

The Art of Presentation Design: Design for the Purpose, Not for the Slide
Almost everyone presents. A CEO presents results to the board, a salesperson presents an offer to a client, an instructor presents a lesson to students, a designer presents a concept, a student presents a graduation project, a founder presents to investors. And almost everyone opens the same software, picks a template and starts typing bullet points. The result is the familiar feeling of “death by PowerPoint”: crowded slides that the presenter reads aloud to a bored room.
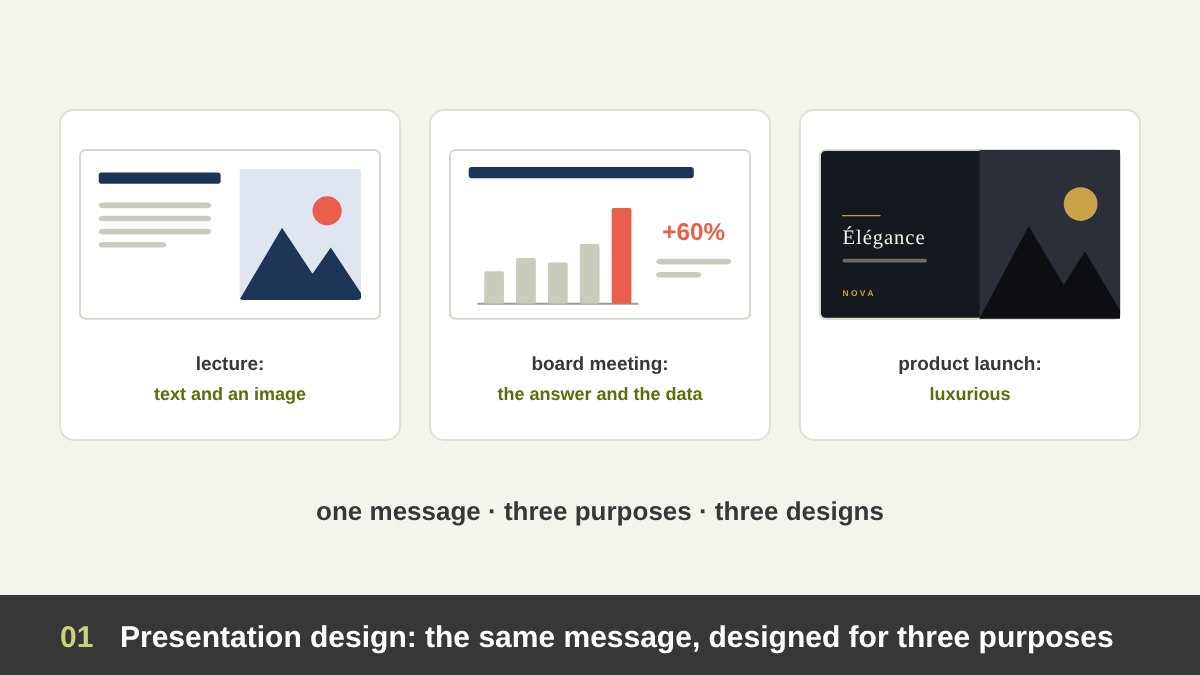
As an art director I design presentations for very different people, from official government reports to brand launches and pitch decks, and I teach students who present their own work. The single most important lesson I have learned is simple: there is no such thing as a good slide in general. There is only a slide that serves its purpose, or one that does not. A slide that is perfect for a lecture can be a disaster in a board meeting, and a slide that wins a luxury client can confuse a class of beginners.
This article is a complete guide to presentation design built around that idea. We will classify presentations by purpose, by who presents, by who is in the audience, by how they are delivered, by method and by visual style. Then we will answer the practical questions: when to make a presentation luxurious and elegant, when to keep it to text and an image, when to use lots of graphics, how to open, which types of slides exist, how to close, and the craft details that make the difference. If you are a designer presenting your own portfolio, read this together with my guide on how to present your design work.
Key takeaways
- Presentation design is not decoration. Every design decision on a slide should serve the purpose of the presentation: to teach, inform, persuade, sell, help someone decide, inspire or report.
- Before you open any software, answer four questions: who is presenting, to whom, why, and how will it be delivered (live, online, sent as a PDF, or playing on its own). The audience matters more than the presenter.
- There is no single “good slide”. A CEO’s board deck, an instructor’s lecture, a designer’s pitch and a conference keynote should look different, because they do different jobs.
- Go luxurious and elegant when the presentation itself is part of the product or the first impression: premium brands, high-value pitches, launches and ceremonies. Keep it to text and one image when clarity and speed matter more than impression. Use lots of graphics only when they explain something words cannot.
- Below you will find every way to classify presentations (by purpose, presenter, audience, delivery, method and visual style), a decision map, how to open and close, every type of slide, typography, colour, data, animation, Arabic and online presentations, tools, mistakes, a reference table and a checklist.
What Presentation Design Really Is
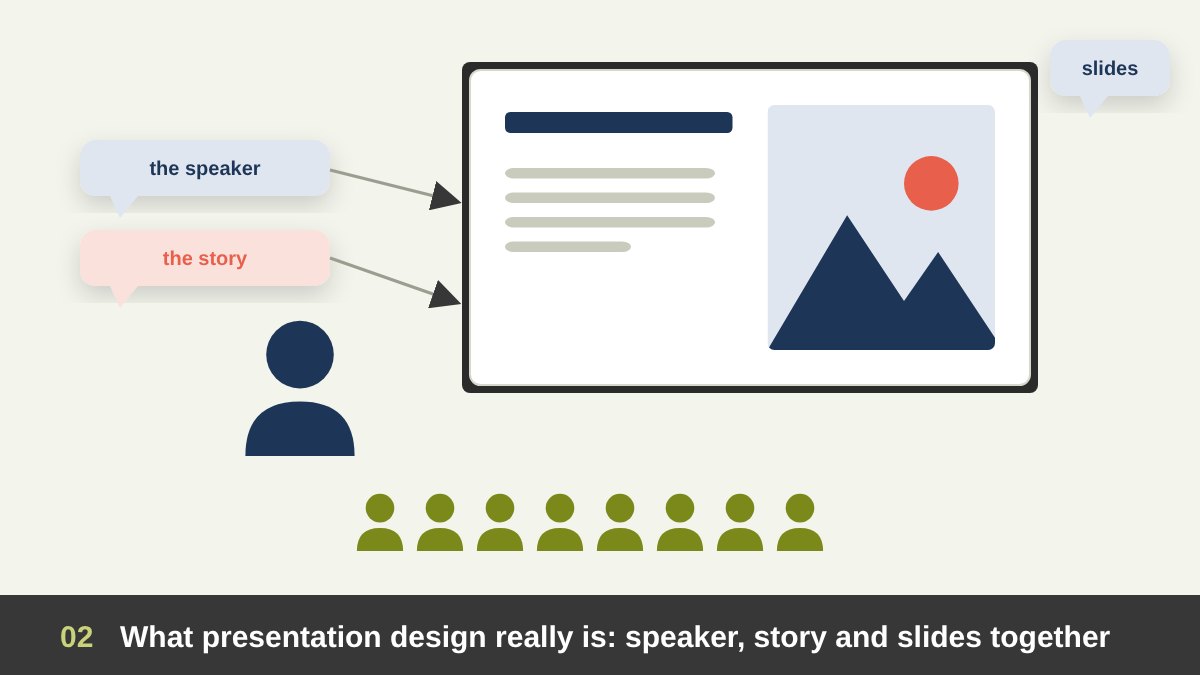
A presentation has three parts: the speaker, the story and the slides. Presentation design is the craft of shaping the slides (and often the story) so that the three work together. The slides are a visual support for a message. They are not the message itself, and in most live presentations they are not the speaker’s notes either.
Slide software is younger than many people think. PowerPoint was created by Robert Gaskins and Dennis Austin at Forethought and released in 1987, the same year Microsoft bought the company. Apple’s Keynote followed in 2003, Google’s online slides in 2007, Prezi in 2009, Canva in 2013 and Figma Slides in 2024. The tools changed; the problem did not. In 2003 the information designer Edward Tufte published The Cognitive Style of PowerPoint, arguing that bullet-point templates break reasoning into fragments. The same year, the board that investigated the Space Shuttle Columbia accident criticised the way an important engineering finding had been buried in a crowded slide of nested bullets.
Good presentation design is therefore not about making slides “pretty”. It is applied design principles: hierarchy, contrast, alignment, white space, colour and typography used to make one idea at a time easy to see, understand and remember.
Start With Purpose: Four Questions Before You Open Any Software
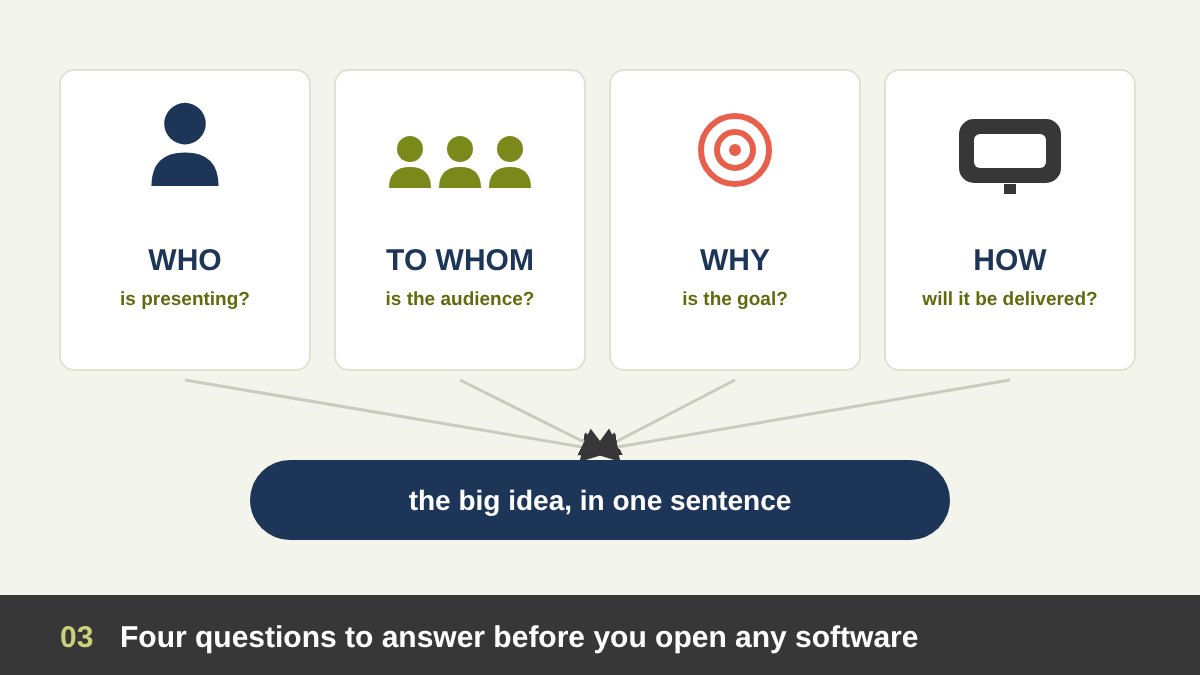
Before choosing a template, colours or fonts, answer four questions. They decide almost everything else in this article.
1. Who is presenting? Their role, authority, personality and skill as a speaker. A confident keynote speaker can carry a slide with one word; a nervous junior employee may need more structure on screen.
2. Who is the audience? What do they already know, what do they care about, how much time and attention do they have, and what will they do after the presentation? Senior people want conclusions; beginners need steps; clients want to see themselves in the solution.
3. Why are you presenting? Name the goal with a verb: teach, inform, persuade, sell, get a decision, inspire, report or celebrate. Then write the big idea in one sentence: what the audience should believe or do when you finish. If you cannot write that sentence, no design will save the presentation.
4. How will it be delivered? Live in a room, on a big stage, in a video call, sent as a PDF to be read alone, printed, or playing on a screen at an exhibition. Each of these needs a different density of text and a different design.
Types of Presentations by Purpose
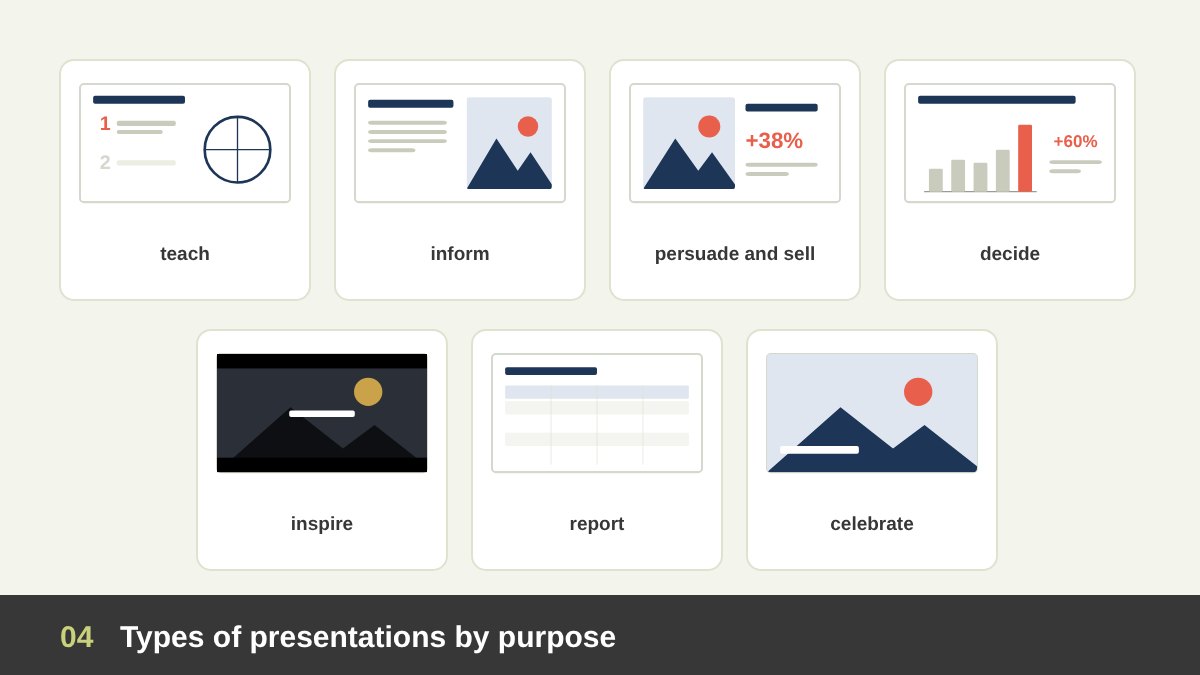
The most useful way to classify presentations is by what they are trying to achieve. The purpose tells you how much text, how much emotion and how many visuals the slides need.
Educational presentations (lessons, training, workshops) aim at understanding and memory. They need clear structure, one concept per slide, examples, step-by-step reveals and summaries. Informative presentations (updates, briefings, announcements) aim to make people aware of facts quickly; clarity and brevity win. Persuasive and sales presentations (pitches, proposals, offers) aim to change a belief or win a client; they combine evidence with emotion and must look as credible as the offer. Decision presentations (board meetings, management reviews) aim to get a yes or no; they put the recommendation first and support it with data.
Inspirational presentations (keynotes, launches, vision talks, TED-style talks) aim to make people feel something and remember one idea; they are image-led, with very little text. Reports (annual results, research findings, project status) aim to document; they are often read rather than presented, so they can hold more detail. Ceremonial presentations (awards, weddings, graduations, anniversaries) aim to celebrate; atmosphere, photography and elegance matter more than information.
Types of Presentations by Who Presents
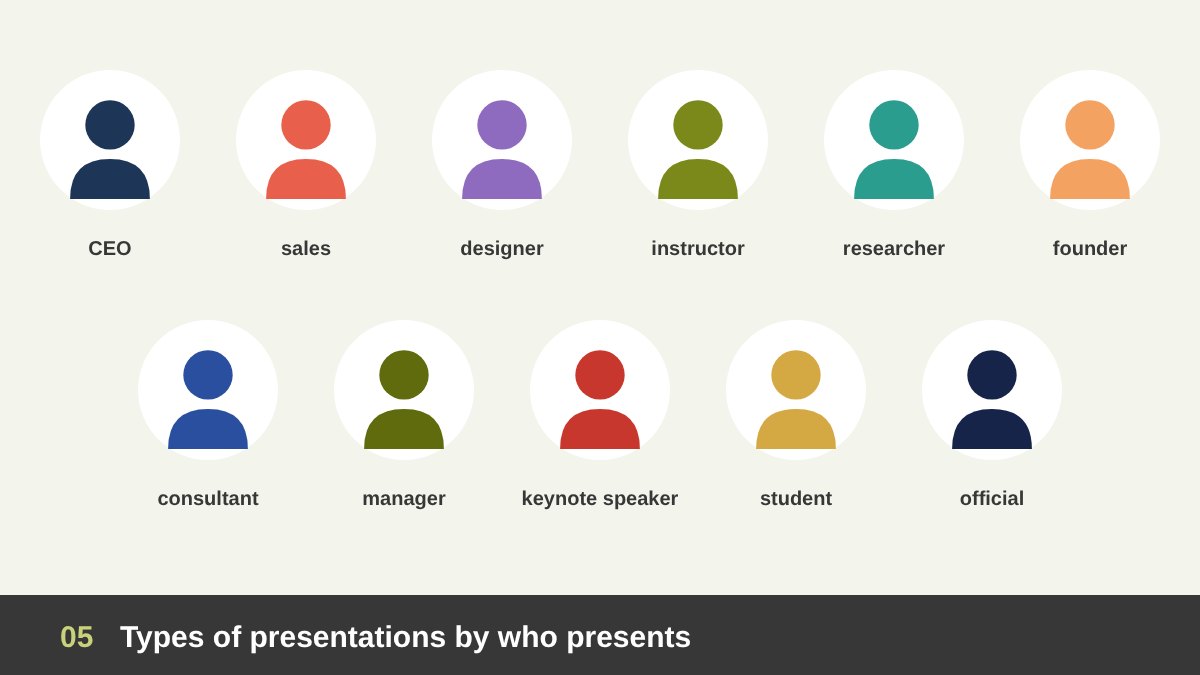
The presenter’s role shapes expectations. Here are the most common presenters and what their slides usually need.
CEOs and senior executives present strategy, results and vision. Their slides should look calm, confident and on brand, with few words and clear numbers; clutter makes a leader look unsure. Sales and business development teams present offers; their slides must be adaptable to each client and easy to send afterwards. Designers and agencies present creative work; their deck is itself proof of their taste, so it must be designed with the same care as the work. Instructors and trainers present lessons; they need clarity, structure and slides that students can review later.
Researchers and academics present findings at conferences and defences; they need accurate charts, figures, methods and references, with sentence headlines that state each finding. Startup founders present to investors; they need a tight story from problem to traction to the ask. Consultants and analysts present recommendations; they rely on action titles and data. Managers and team leads present internal updates; speed and clarity beat polish. Keynote and public speakers rely on themselves, so their slides are big images and few words. Students present to teachers and juries; their slides must show understanding and structure. Government and institutional officials present formally, often bilingually, with strict branding and protocol.
Notice that the same person can be several of these. That is why the presenter alone never decides the design: the audience does.
Types of Presentations by Who Is in the Audience
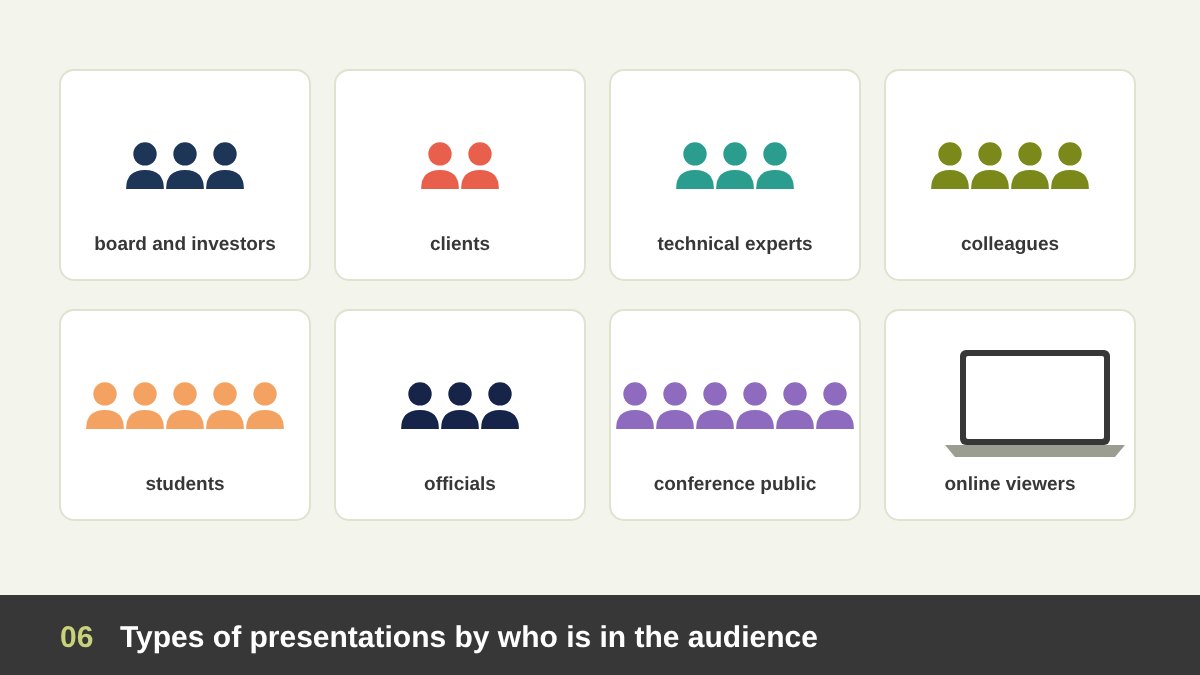
If you remember only one rule from this article, make it this one: design for the audience, not for the presenter. The same content must be designed differently for different people.
Boards and investors have little time and high stakes; give them the conclusion first, the numbers that support it and an appendix for questions. Clients want to see their own problem and their own brand; put them, not your company history, at the centre. Technical experts want detail and accuracy and will forgive plain design, never wrong data. Colleagues and internal teams need what has changed and what is expected of them. Students and trainees need small steps, examples, repetition and time to think.
Government officials and formal committees expect protocol: correct titles, logos, order of names and often Arabic and English. Conference audiences are mixed and far from the screen; they need big visuals and one memorable idea. Online viewers watch on laptops and phones while distracted by other tabs; they need bigger text, faster visual change and a clear structure.
A useful test is to imagine one real person from the audience and ask: what does this person need to see on this slide, right now, to follow me?
Same Presenter, Different Audience: One CEO, Three Presentations
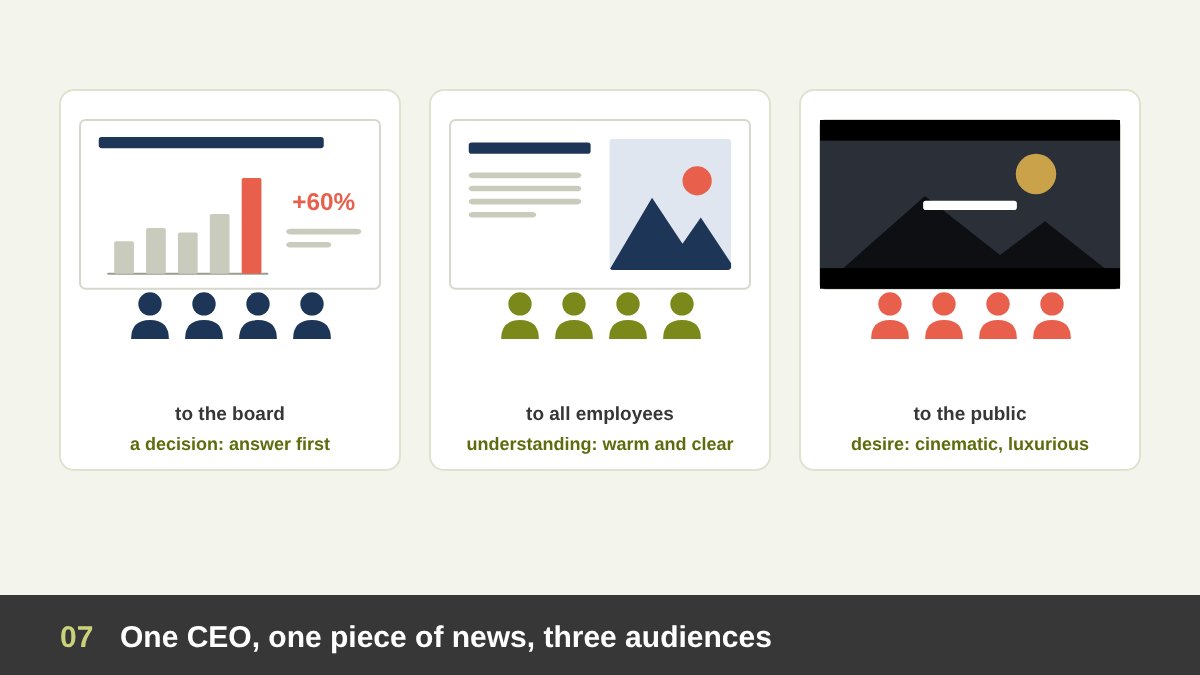
Take a single CEO and a single piece of news: the company is launching a new product line. Watch how the design changes with the audience.
To the board, the goal is a decision. The first slide states the recommendation (“Launch in March with a budget of X”), followed by the market, the numbers, the risks and the ask. The design is clean, restrained and branded, with action titles and clear charts. No dramatic photography, no animation beyond simple builds.
To all employees, the goal is understanding and energy. The slides explain why the launch matters, what changes for each team and when. The design is warmer: real photos of the team, simple icons, a friendly tone and a short timeline.
To the public at the launch event, the goal is desire. The slides become a show: dark backgrounds, one large product image per slide, a few words in large elegant type, cinematic transitions, video. This is where a luxurious, elegant design is fully justified, because the presentation is part of the product experience.
Instructor vs CEO: Why a Lecture and a Board Deck Should Not Look Alike
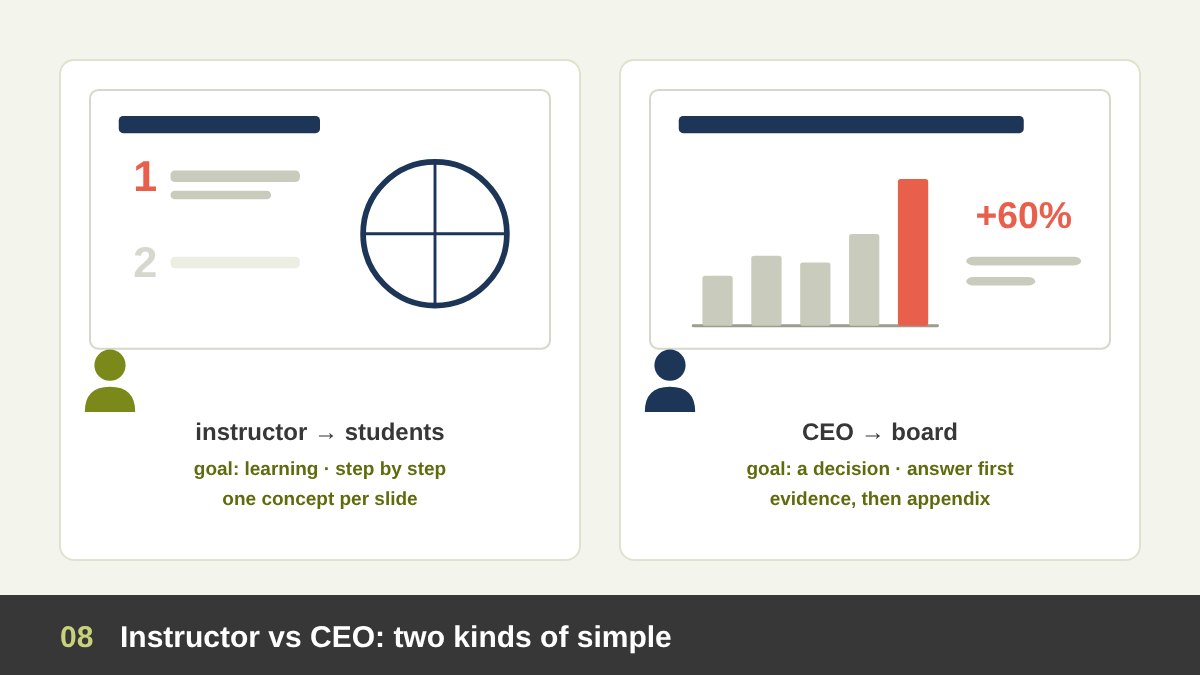
A question I am often asked is exactly this: is there a difference between an instructor presenting to students and a CEO presenting to the board? There is, and it is large.
The instructor’s goal is learning. Students meet the ideas for the first time, the session is long, and the slides are often shared as study material afterwards. So the slides should present one concept per slide, build up step by step, use diagrams and worked examples, repeat key terms, include small exercises or questions, and end each part with a summary. A consistent simple template helps students focus on content. Luxury here is a distraction; clarity is the luxury. Research on multimedia learning (Richard Mayer) supports this: people learn better when irrelevant decoration is removed and when words and pictures that belong together appear together.
The CEO’s goal (in a board meeting) is a decision. Board members know the business, have little time and many documents. The slides should give the answer first, show only the evidence needed, use sentence headlines that state the point, and keep the details in an appendix. The design should be calm, precise and on brand, because sloppiness in front of the board reads as risk.
Both are simple, but in different ways: the instructor’s simplicity is step-by-step; the executive’s simplicity is answer-first.
Types of Presentations by Delivery: Live, Online, Read-Alone, Self-Running
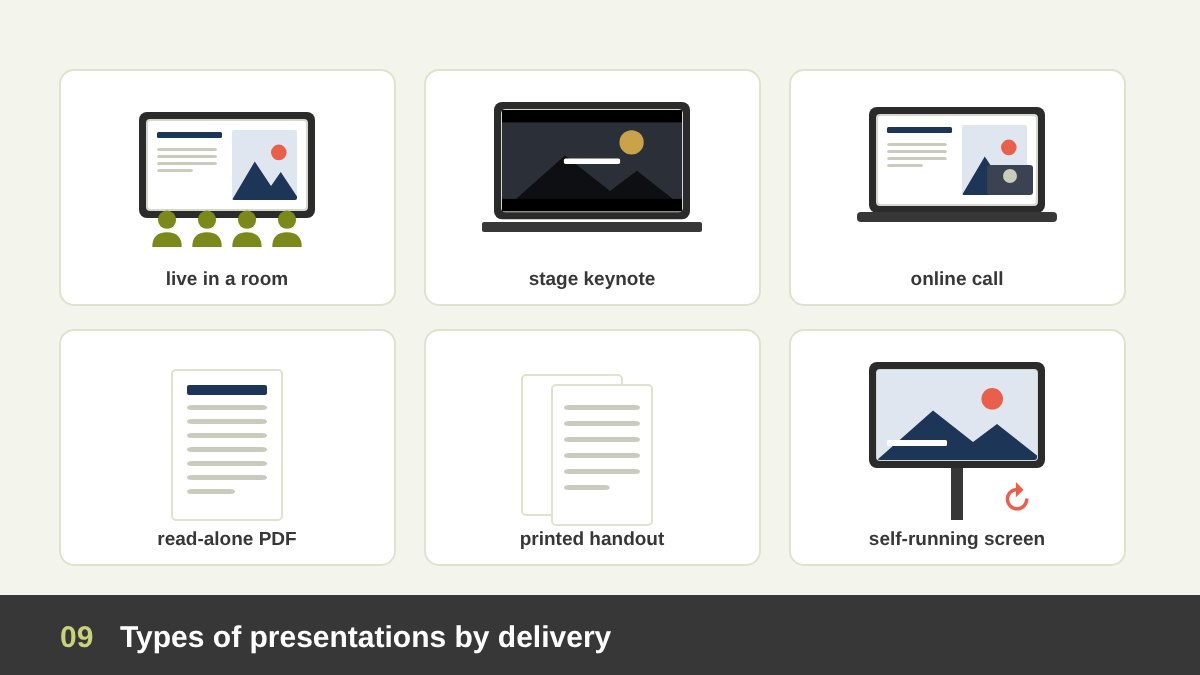
How the audience receives the slides changes the design more than almost anything else.
Live presentations in a room are speaker-led: the slides should be visual and light, because the speaker carries the detail. Stage keynotes are the extreme version: huge images, very few words, high contrast for big screens. Online presentations and webinars are seen small, with the speaker’s face in a corner; use larger text, change the visual more often to hold attention, and keep important content away from the edges where video tiles may cover it.
Read-alone decks are sent by email or shared as PDFs, and nobody is there to explain them. They need full sentences, clear headlines and more detail; the designer Nancy Duarte calls this kind of document a slidedoc. Printed handouts should be designed for paper, with readable type and colours that survive printing. Self-running presentations on screens at exhibitions and in lobbies have no speaker and no reader patience; they need a few strong messages, motion and a loop of seconds, as I describe in exhibition booth design.
The most common mistake is trying to make one deck do two jobs: projected live and sent as a document. A slide that is light enough to present is too thin to read; a slide that is complete enough to read is too heavy to present. When both are needed, make two versions: a presenting deck and a leave-behind document, or put the detail in the speaker notes and an appendix.
Presentation Methods and Styles You Should Know
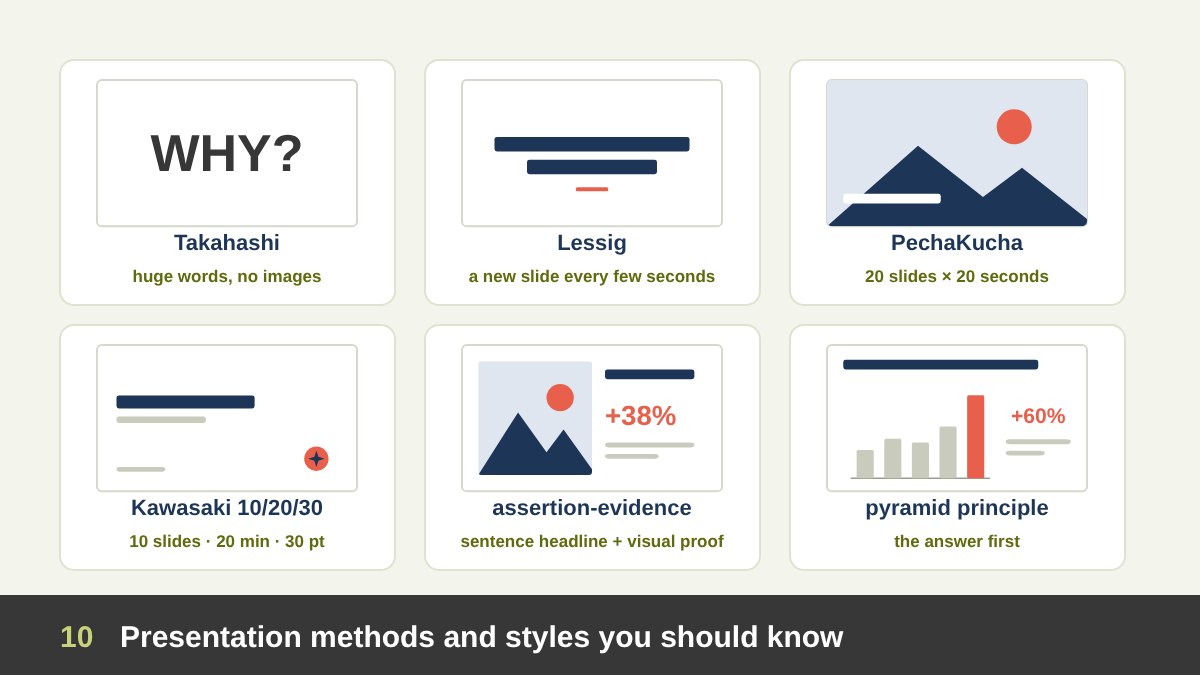
Over the years presenters have invented methods that are worth knowing, because each one solves a specific problem.
The Takahashi method, from the Japanese programmer Masayoshi Takahashi in the early 2000s, uses one or a few huge words per slide, no images and no bullets. It works for fast, energetic talks. The Lessig method, associated with the law professor Lawrence Lessig, changes slides every few seconds, each with a word, phrase or image synchronised with the speech. PechaKucha, created in Tokyo in 2003 by the architects Astrid Klein and Mark Dytham, uses exactly 20 slides shown for 20 seconds each, which forces focus and visual storytelling.
Guy Kawasaki’s 10/20/30 rule for pitches says: 10 slides, 20 minutes, and no font smaller than 30 points. The assertion-evidence approach, promoted by the engineering professor Michael Alley, replaces topic titles and bullets with a full-sentence headline (the assertion) supported by visual evidence such as a photo, diagram or chart; studies by Alley and colleagues found that students understood technical content better with it. The pyramid principle of Barbara Minto, from her work at McKinsey, puts the answer first and then supports it with grouped arguments; it is the backbone of consulting and board decks.
Finally, the Presentation Zen approach of Garr Reynolds (2008) and the books of Nancy Duarte (slide:ology, 2008, and Resonate, 2010) popularised simple, image-led slides and story structure. Some organisations go the other way: Amazon replaced slides in senior meetings with six-page written memos in 2004, because complex decisions need full sentences. You do not need to adopt one method for everything; choose the one that fits the purpose.
Visual Styles of Presentations
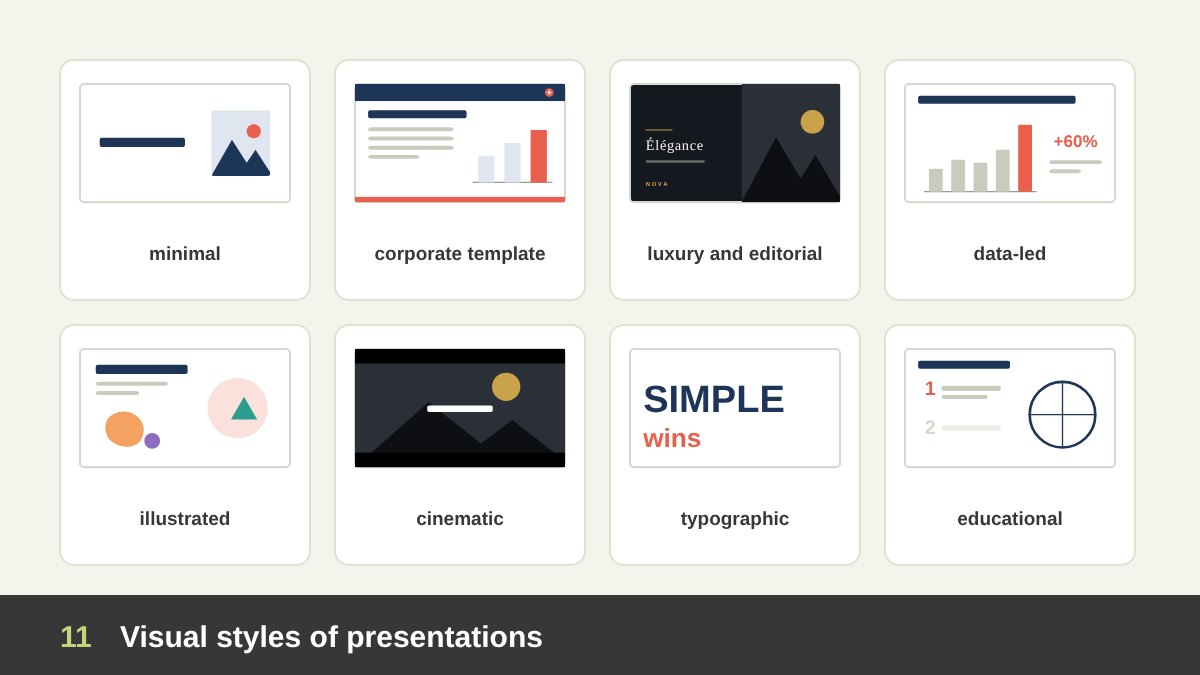
Apart from methods, presentations have visual styles. Each style sends a different signal before a single word is read.
Minimal: lots of white space, one idea, one image or a few words; suits keynotes, talks and most live presentations. Corporate template: a branded master with fixed title positions and colours; suits internal and sales decks that many people produce. Luxury or editorial: dark or ivory backgrounds, refined serif or light sans-serif type, full-bleed photography and generous margins; suits premium brands and high-value pitches. Data-led: action titles, charts and tables on a quiet grid; suits boards, consulting and research.
Illustrated or playful: custom illustrations, characters and bright colours; suits children, education, campaigns and friendly brands. Cinematic or photographic: full-screen images and video with minimal type; suits launches, tourism, real estate and storytelling. Typographic: big words as the main visual; suits manifestos, quotes and fast talks. Educational or infographic: diagrams, numbered steps and icons; suits lessons and explainers.
Choosing the style is not a matter of taste. It follows from the four questions: the purpose, the presenter, the audience and the delivery.
When to Go Luxurious, Elegant and Premium
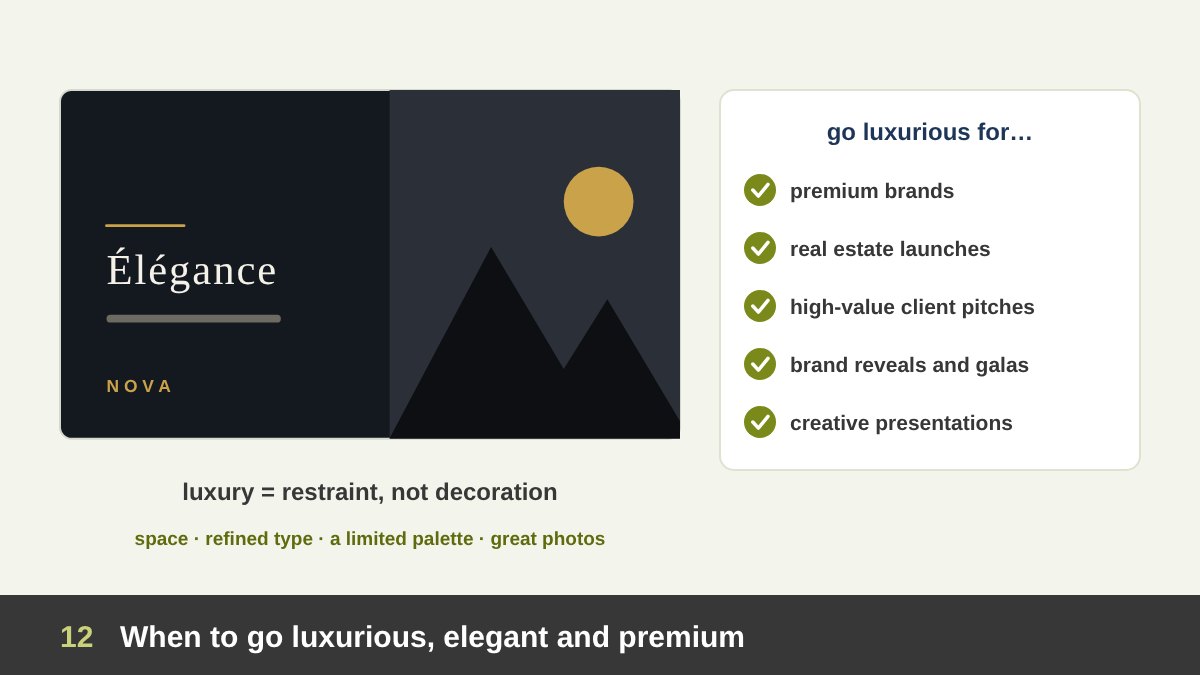
A luxurious, elegant presentation is justified when the presentation itself is part of the experience you are selling, or when first impressions carry high stakes. Typical cases: premium brands (jewellery, fashion, perfume, cars, hotels), real estate launches, a high-value pitch to a major client, an investor roadshow for a premium company, a brand reveal, an award ceremony or gala, a wedding or an anniversary, and a designer or agency presenting creative work to a demanding client.
The secret is that luxury is restraint, not decoration. Elegant slides use fewer elements, not more: generous margins and white space, a restricted palette (for example black, ivory and one metallic or deep accent used sparingly), refined typography such as a high-contrast serif for headlines and a light sans-serif for text, small spaced capitals for labels, large high-quality photography, precise alignment and slow, subtle transitions. Gold gradients, bevelled text, shadows on everything, ornaments in every corner and stock photos of handshakes make a presentation look cheap, not rich.
“Sympathetic” and warm can sit with elegance: real photographs of people, a calm tone of voice, soft natural colours and enough space to breathe. Luxury that feels cold can lose a client as quickly as clutter.
Luxury costs time and money, so use it where it pays: the opening, the key visuals and the closing. Even a premium deck should keep its data slides clear and readable.
When to Keep It Simple: Just Text and an Image
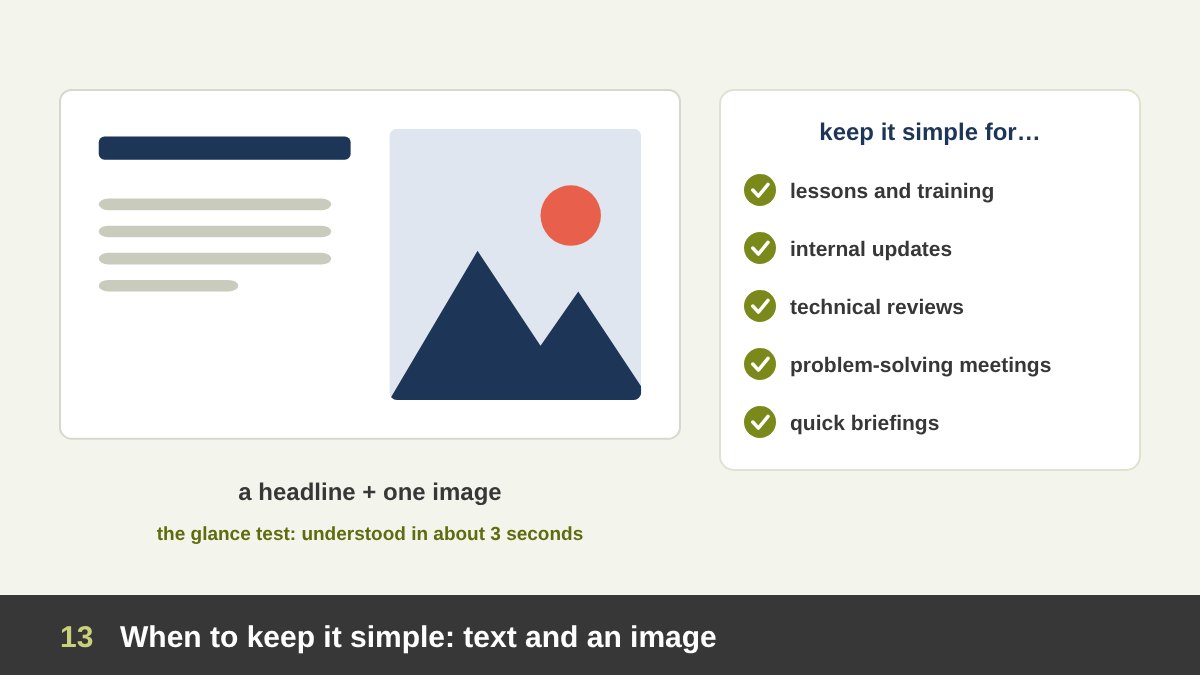
Simplicity is the right choice when clarity, speed and focus matter more than impression. Typical cases: lessons and training, internal meetings and status updates, technical reviews, crisis or problem-solving meetings, quick briefings, and any presentation made under time pressure. Simple slides are also the best default for nervous or inexperienced presenters, because the audience listens instead of reading.
The classic simple slide is a short headline and one image beside it, or a single sentence on a plain background. Simple does not mean lazy. It still needs a strong headline that states the point, a well chosen image that shows rather than decorates, consistent margins, readable type and one accent colour. A simple deck built on a clean grid can look more professional than an expensive one that tries too hard.
A good test comes from Nancy Duarte: the glance test. If the audience cannot understand the slide in about three seconds, it is too complicated for a live presentation. When a slide fails the glance test, split it into two or three slides, move detail into the speaker notes, or put it in a handout.
When to Use Lots of Graphics, and When Not To
Graphics are powerful because people remember pictures better than words (psychologists call it the picture superiority effect, explained by Allan Paivio’s dual coding theory). But that power works only when the graphic carries meaning.
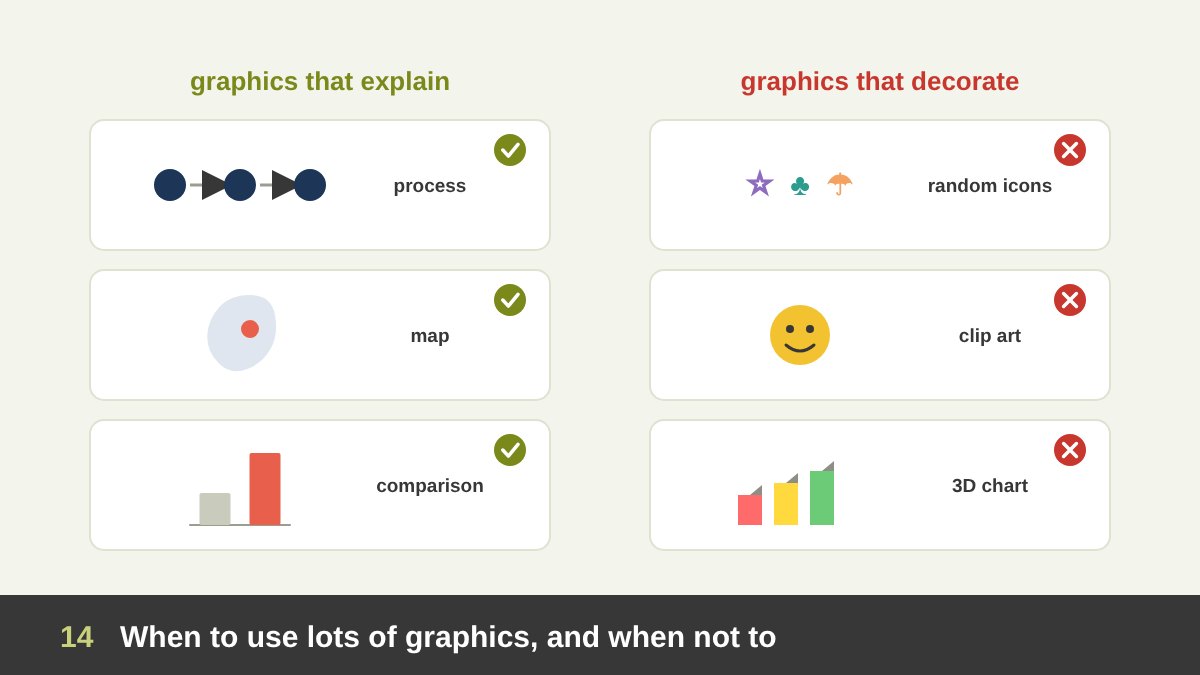
Use lots of graphics when the content is abstract or complex and a visual explains it faster: processes, systems, relationships, comparisons, timelines, maps, data, how something works or looks. Use them when the audience is general, young, or does not share your language well; when you tell an emotional story; for launches and campaigns; and for any visual product, such as architecture, design, food or fashion.
Do not use lots of graphics when they only decorate. Research by Shannon Harp and Richard Mayer (1998) on “seductive details” found that interesting but irrelevant pictures and stories can reduce learning, because they pull attention away from the main idea. Avoid graphics-heavy slides in decision meetings full of numbers, in read-alone documents that need precise detail, in quick internal updates, and when the time to produce them is not there; a rushed set of random icons is worse than none.
A simple rule: for every graphic, ask “what does this explain?” If the answer is “nothing, it looks nice”, remove it or replace it with something that explains.
The Presentation Design Decision Map
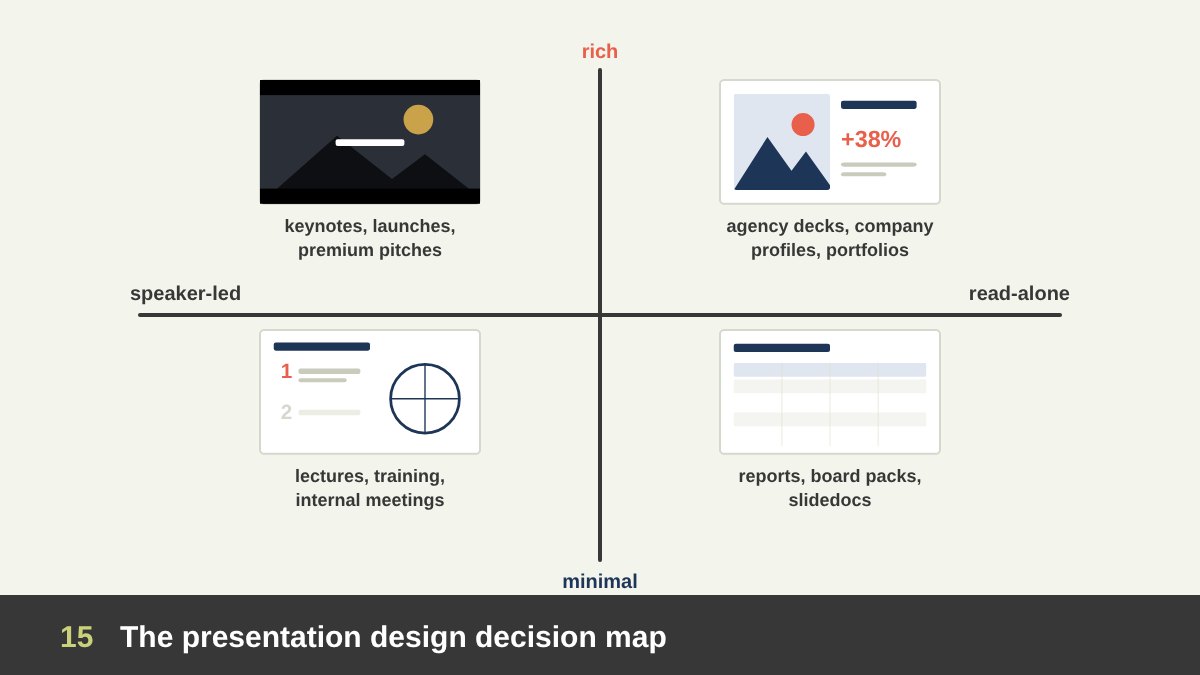
Put everything together on a simple map with two questions.
Is the presentation speaker-led or read-alone? Speaker-led slides can be light, because a person explains them. Read-alone slides must explain themselves.
Should the design be minimal or rich? That depends on whether impression and emotion (launch, premium pitch, ceremony) or clarity and speed (training, internal, data) matter more.
The four corners give four families: speaker-led and rich = keynotes, launches and premium pitches presented live; speaker-led and minimal = lectures, training and internal meetings; read-alone and rich = sales and agency decks sent by email, company profiles and portfolios; read-alone and minimal = reports, board packs and slidedocs. Find your corner first, then choose the method, style and amount of text and graphics that belong there. The reference table near the end of this article lists the most common presentation types with their settings.
How to Start a Presentation: Introduction or Straight to the Point?
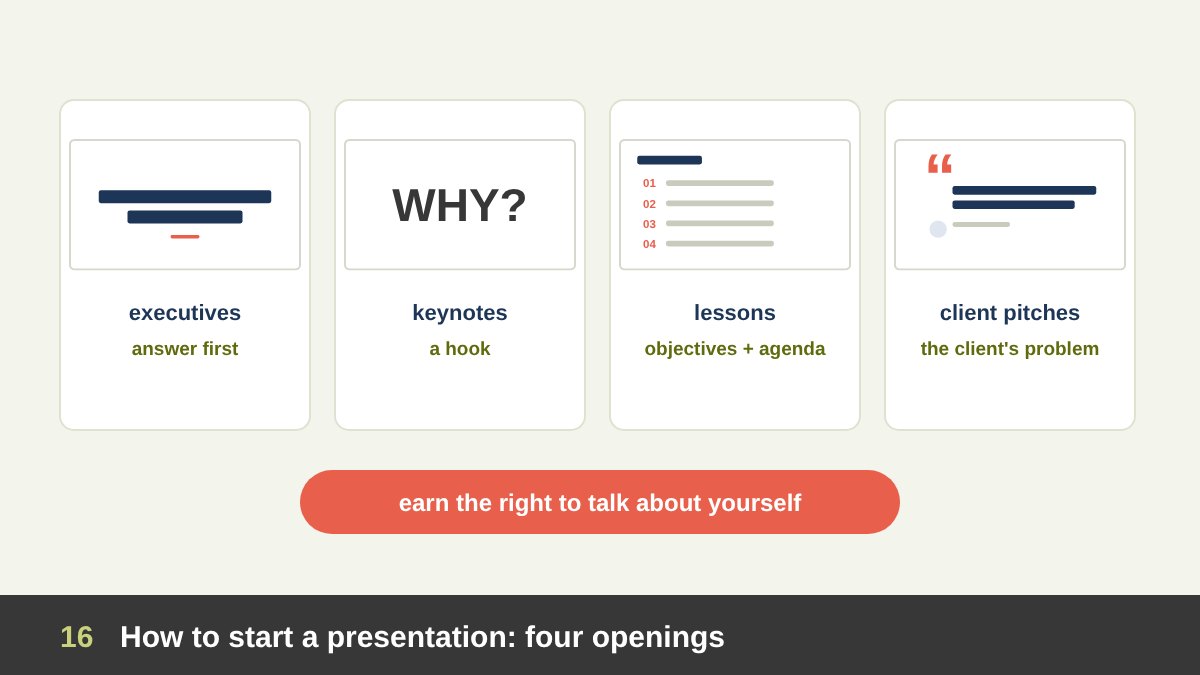
Should you start with an introduction about yourself and your company, or go straight into the topic? The answer depends on the audience, but one rule is universal: you must earn the right to talk about yourself. Nobody came to hear your company history; they came for what it means for them.
Always begin with a title slide that tells people where they are: the title, the presenter, the date or the event. Then choose the opening that fits. For executives and decision makers, start with the answer: the recommendation or the main finding in the first one or two slides, then the evidence (this is the pyramid principle, also called “bottom line up front”). For keynotes and inspirational talks, start with a hook: a question, a short story, a surprising fact or a striking image, followed by the promise of what the audience will gain.
For lessons and training, start with orientation: why the topic matters, the learning objectives and a short agenda, so students know the route. For client pitches, start with the client: their goal or problem in their words, then your understanding and solution. Your credentials can come later in one or two slides, when the client already wants to know who can deliver this.
An agenda slide helps in long presentations (training, workshops, reports) and is usually unnecessary in a ten-minute talk. A personal introduction is useful when the audience does not know you and your credibility matters; keep it to one slide and one minute.
Structure the Story First: Outline and Storyboard Before the Slides
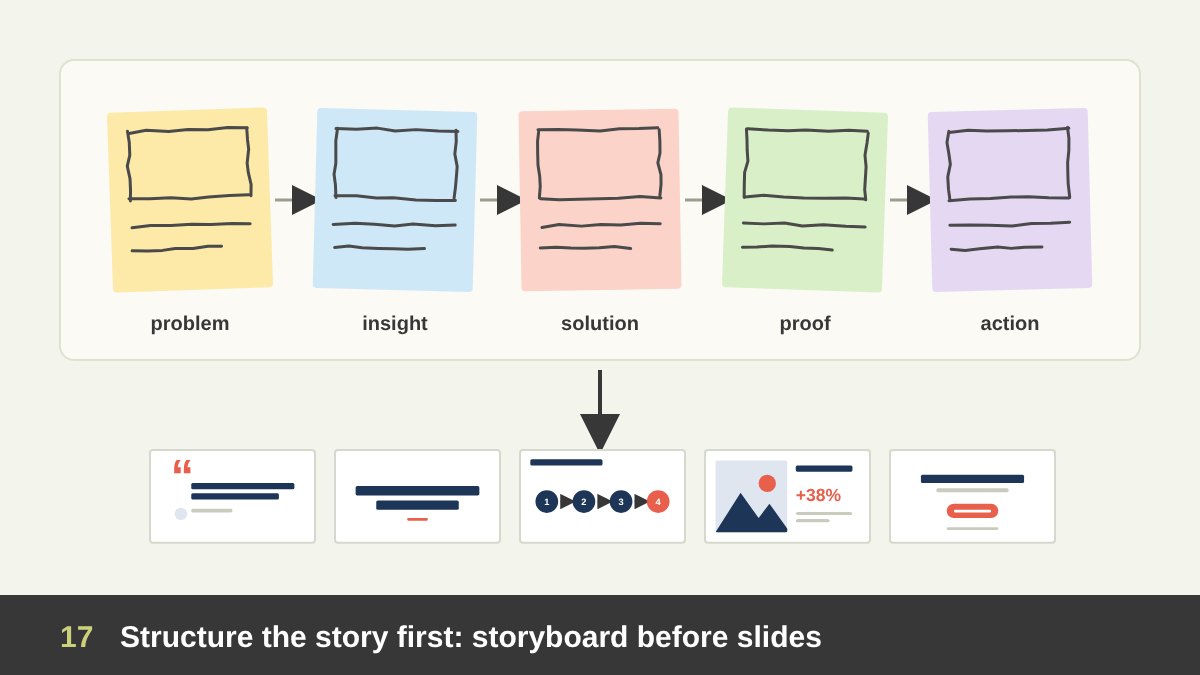
The biggest improvement most presentations need is not design at all; it is structure. Professional presentation designers start away from the software: they write the big idea, list the key messages and sketch the flow on paper or sticky notes. Drawing small thumbnails of each slide is the fastest way to test the order and the visuals, as I explain in the importance of drawing for designers.
A reliable structure for persuasive presentations is problem, insight, solution, proof, action. Educational presentations work well as why, what, how, practice, summary. Reports follow summary, findings, details, next steps. Investor decks often follow an order similar to the template published by the venture firm Sequoia: purpose, problem, solution, why now, market, competition, product, business model, team, financials and the ask.
Group content in threes when you can. Steve Jobs introduced the iPhone in 2007 as “an iPod, a phone and an internet communicator”, three ideas the audience could hold in mind. Write one message per slide and turn it into the slide’s headline. If you read only the headlines of your deck in order, they should tell the whole story.
Types of Slides and When to Use Each One
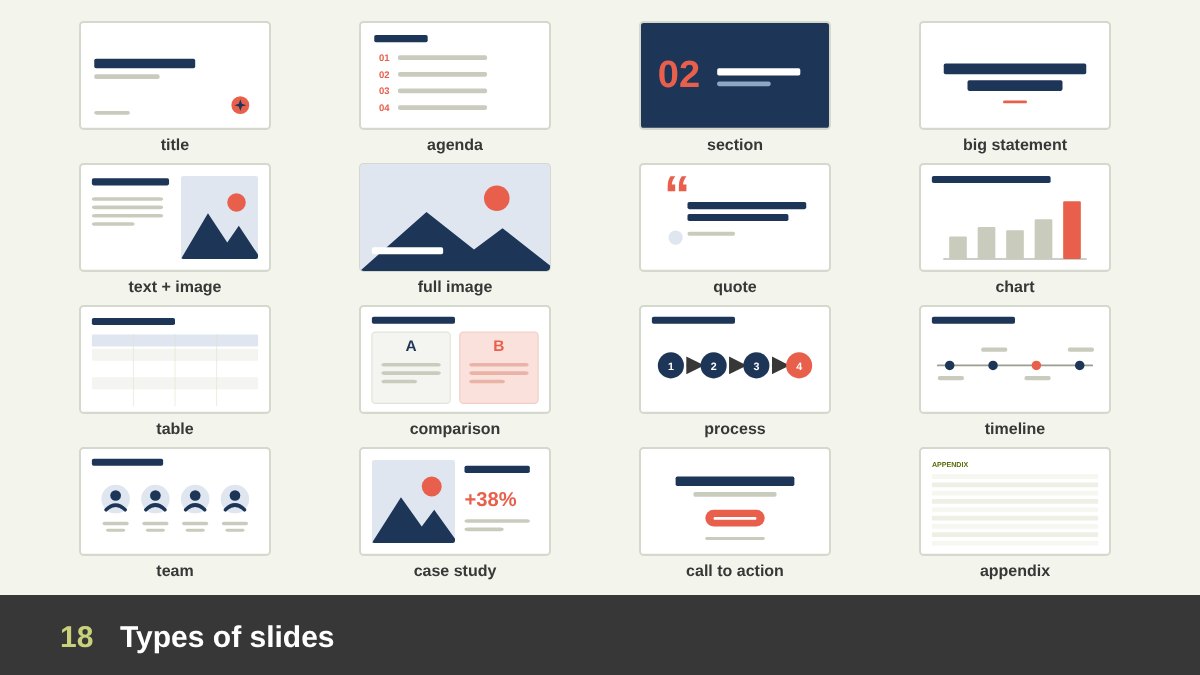
Every presentation is built from a small vocabulary of slide types. Designing them as a set in the master template makes the deck consistent and fast to build.
Title slide: title, subtitle, presenter, date, logo; it sets the tone, so make it the most designed slide. Agenda: the route, for long presentations. Section divider: a pause between parts, often a full colour or image with a number; it helps the audience know where they are. Big statement: one sentence or number, large, for key messages. Text and image: the workhorse slide, a headline, a few words and a supporting picture. Full-bleed image: one photograph filling the screen, for emotion and atmosphere. Quote: a testimonial or a powerful line with its source.
Chart: one chart with an action title that states what it shows. Table: for exact values, better in read-alone decks or appendices. Comparison: before and after, option A and B, us and them. Process or diagram: steps, cycles, frameworks. Timeline or roadmap: history or plans. Team: people with photos and roles. Case study or proof: results, client logos, testimonials. Offer or pricing: in sales decks. Summary: the three things to remember. Call to action: what you want the audience to do. Q&A and contact: how to reach you. Appendix or backup: detailed data for questions, placed after the end.
Most decks need only six to ten of these types. Use the same type for the same job every time, so the audience learns the visual language quickly.
How to End: Summary, Call to Action and the Last Slide
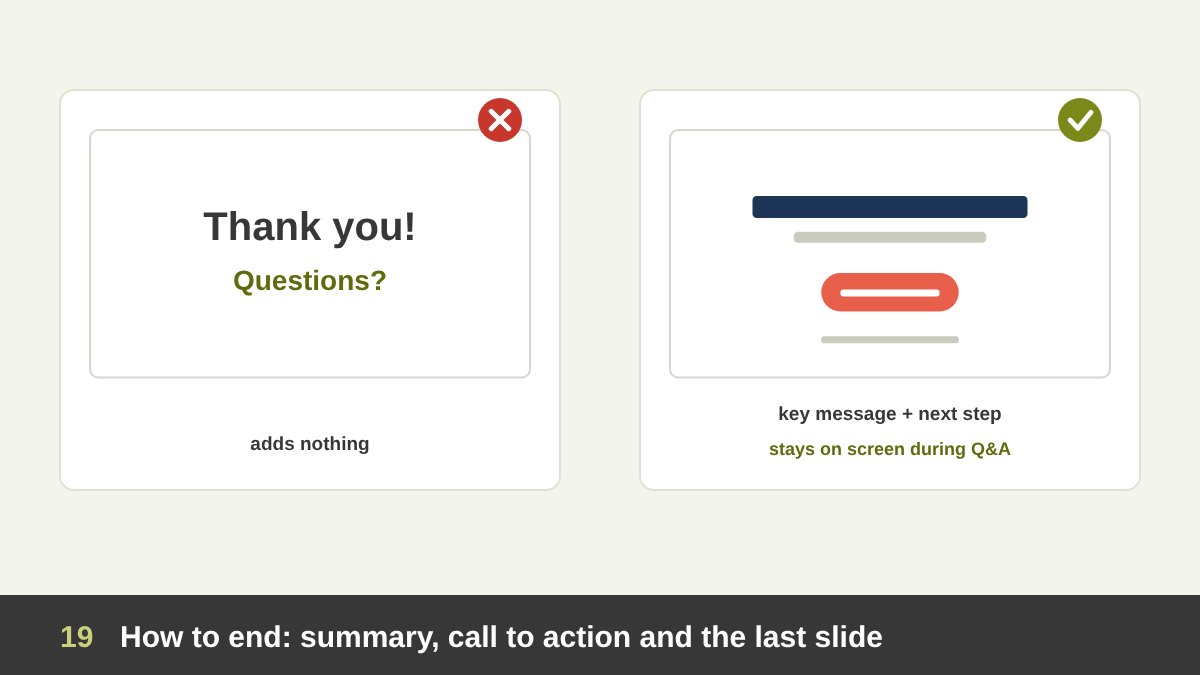
The end of a presentation is what people remember best, yet many decks end with a slide that says only “Thank you” or “Questions?”. That slide stays on screen for the whole discussion and adds nothing.
End instead with a summary of the key message (three points at most) and a clear call to action: approve the budget, book the next meeting, try the exercise, visit the website. Then open questions while that closing slide, with your key message and contact details, stays on screen. After the questions, return to the key message in one sentence so the last thing heard is your point, not the last question.
In teaching, the end is a recap and a small task; in a pitch, it is the next step and the date; in a keynote, it is often a return to the opening story, which gives the talk a satisfying circle. Keep backup slides after the closing slide so you can open them if someone asks for detail.
Typography for Slides
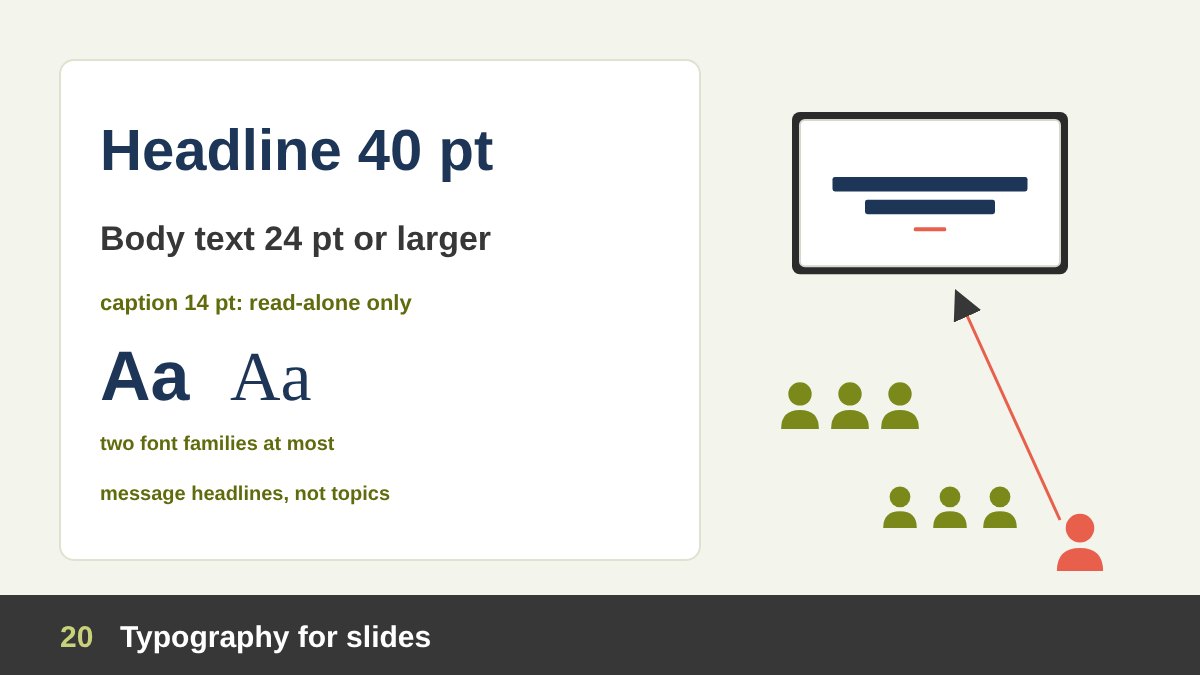
Typography makes or breaks slides, because people must read from far away and fast.
Size: for live presentations, keep body text at about 24 points or larger and titles around 36 to 44 points on a 16:9 slide; Kawasaki’s 30-point minimum is a good discipline for pitches. Large rooms and online viewers need even bigger type. Read-alone decks can use smaller sizes, like a document. Test by standing at the back of the room, or by viewing the slide at a small size on your laptop.
Fonts: use one or two families at most, chosen for the brand and for readability at a distance. Sans-serif families are the safest for screens; elegant serifs work well for large headlines in luxury and editorial styles. Avoid thin weights for small text on projectors, and avoid all-caps paragraphs. Make sure the fonts are installed, embedded or exported as PDF, or the layout will break on someone else’s computer.
Headlines: write them as messages, not topics. “Sales grew 18% after the new website” teaches more than “Sales results”. Keep lines short, align text left (or right in Arabic) rather than centring long paragraphs, and give text room to breathe.
Colour, Contrast and the Room
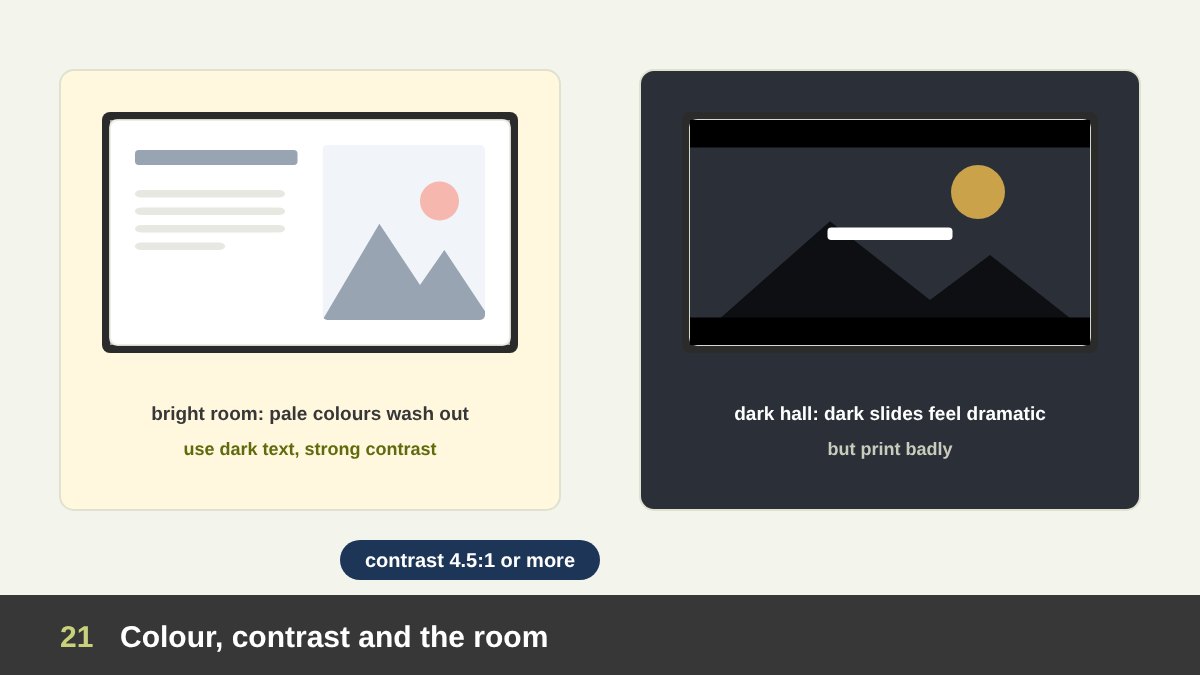
Colours that look perfect on your monitor can disappear on a projector. Projectors wash out pale colours and low contrast, especially in bright rooms. Design for the worst screen you might meet.
Light or dark background? Light backgrounds with dark text work well in bright rooms, meetings and documents that may be printed. Dark backgrounds with light text feel dramatic and elegant and work well in dark halls and on stage, but they print badly and can tire the eyes in long sessions. Choose for the room and the delivery, not only for taste.
Contrast: aim at least for the accessibility guideline WCAG’s ratio of 4.5:1 for normal text (3:1 for large text), and more on projectors. Never put text over a busy photograph without a dark overlay or a solid panel. Colour meaning: use one accent colour to highlight what matters and keep the rest neutral. Remember that about 1 in 12 men and 1 in 200 women have some form of colour vision deficiency, so do not rely on red and green alone to show good and bad; add labels, icons or patterns.
For branded decks, follow the brand palette and its rules, which I cover in brand consistency across every design field.
Layout, Grids and Master Templates
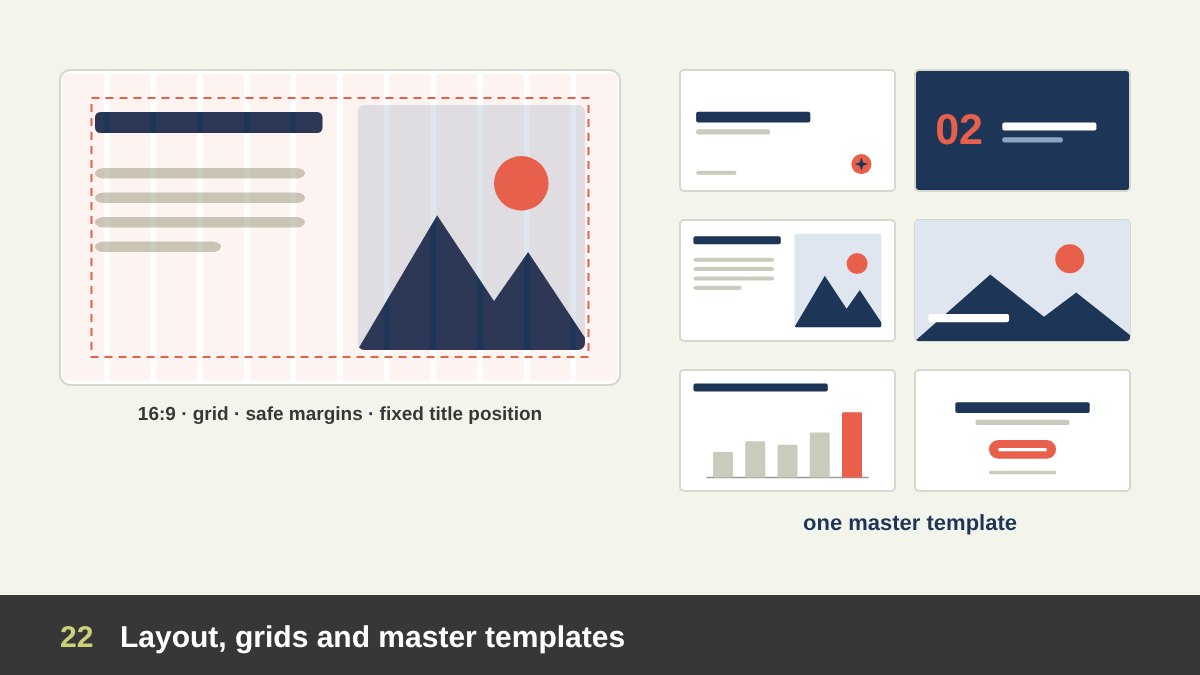
Consistency in position is one of the quiet signals of professional presentations. When the title jumps a few pixels from slide to slide, the audience feels it even if they cannot name it.
Use the 16:9 format for screens (it has been PowerPoint’s default since 2013) unless you know the venue uses another ratio, and ask before big events. Set a grid with safe margins on all sides and keep titles, logos and page numbers in fixed positions. Align everything to the grid: text blocks, images and charts. Leave white space instead of filling every corner.
Build a master template with the slide types the organisation uses: title, agenda, section, content, text and image, full image, chart, quote and closing. A good template guides people who are not designers towards good slides, and keeps a company’s decks consistent. A bad template, full of decorative bars and large logos on every slide, steals space from content and is quickly abandoned.
Charts and Data Slides
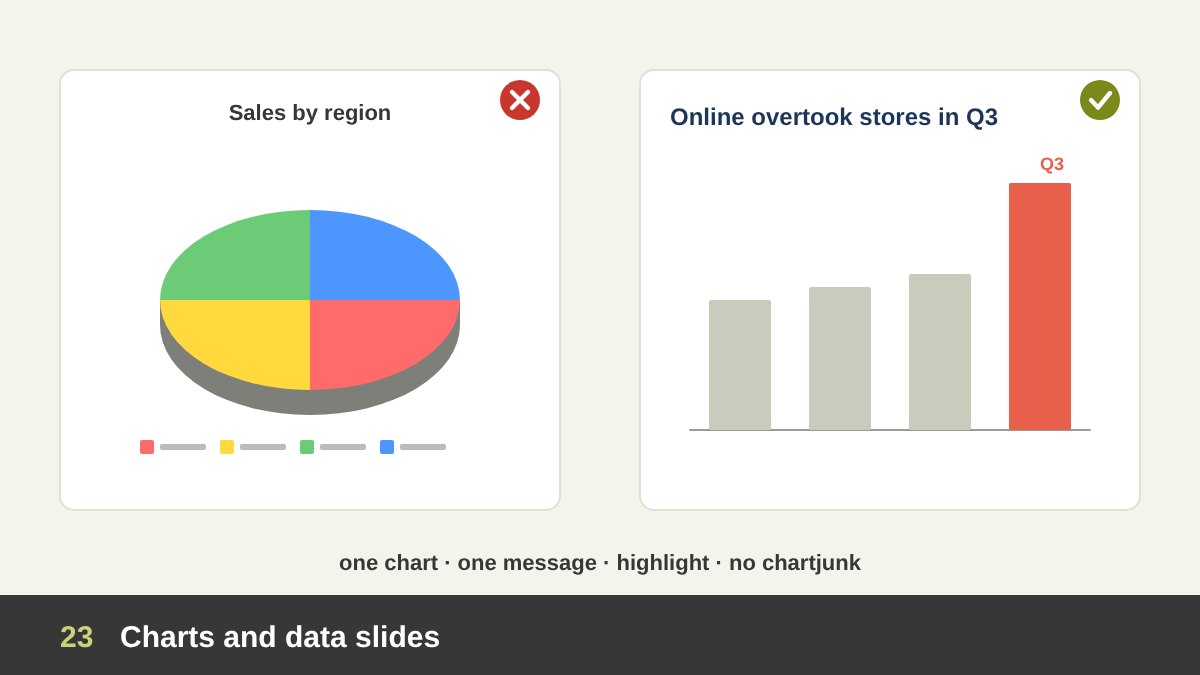
Data slides are where many important decisions are made, and where design is most often abused.
Follow a few rules. One chart, one message: decide what the chart must prove and state it in the headline (“Online sales overtook stores in Q3”). Choose the right chart: bars for comparing categories, lines for change over time, a single big number for one important figure, a table only when exact values matter. Highlight the data that carries the message in the accent colour and show the rest in grey. Remove what Edward Tufte called “chartjunk” in 1983: 3D effects, heavy grid lines, decorative backgrounds and legends that force the eye to jump back and forth (label the lines and bars directly).
Never distort data for impact: start bar charts at zero, keep scales honest and show the source. The Columbia investigation is a reminder that a critical finding can be lost in a poorly designed slide. When the audience needs the full table, give it in the appendix or a handout, and show only the key comparison on screen.
Images, Icons and Video
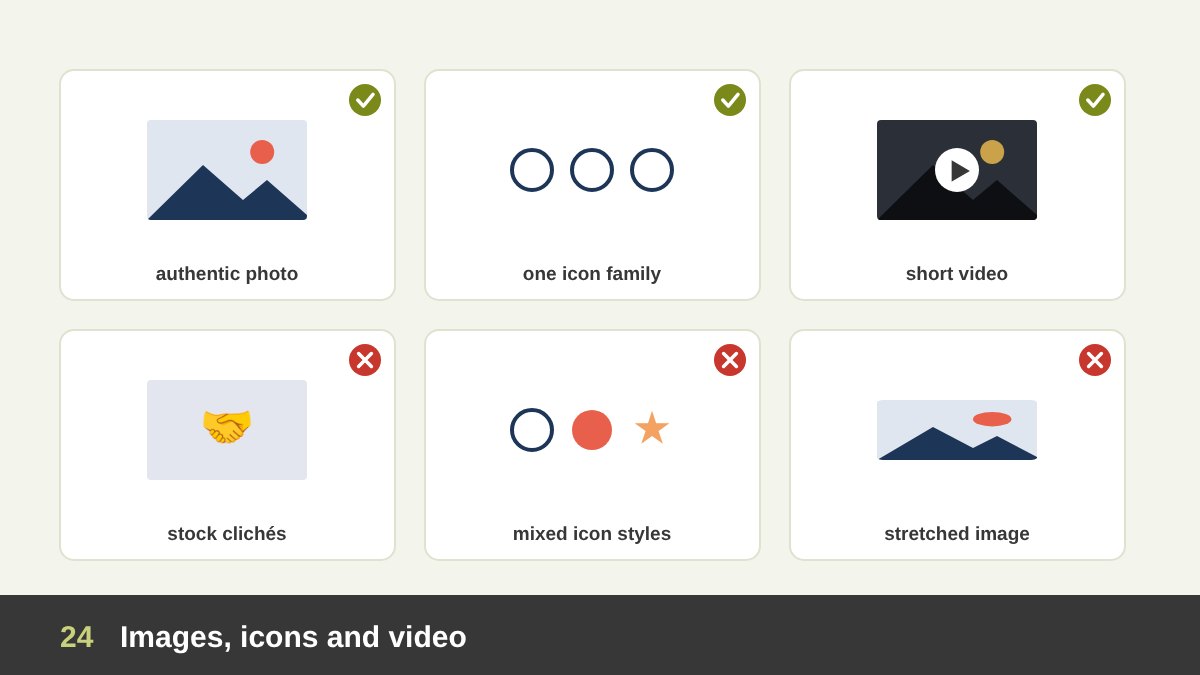
Images carry emotion and meaning, so choose them like words. Prefer authentic photographs of real people, products and places over clichéd stock images (the handshake, the light bulb, the person pointing at a transparent screen). Use high resolution, never stretch an image out of proportion, and crop with intention so the subject has room.
For icons, use one consistent family (same line weight, corner style and size) and only where they help scanning; a slide of twelve unrelated icons is noise. Video is powerful for demos and emotion, but keep clips short, embed or test them before the session and always have a still image as backup in case the video fails.
Respect copyright: use your own images, licensed stock or properly credited public-domain works. AI-generated images can help with concepts and moodboards, but check them carefully for errors, avoid imitating identifiable artists or brands, and remember that their legal status is still developing, as I discuss in AI and Adobe for graphic designers.
Animation and Transitions
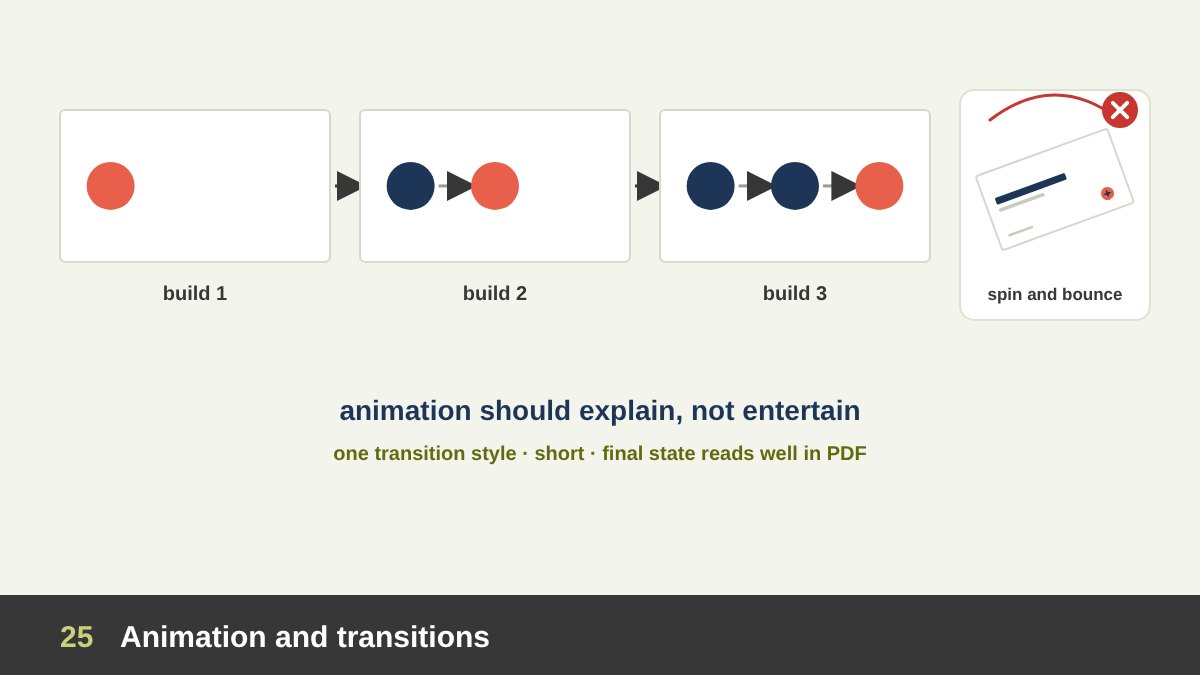
Animation should explain, not entertain. The most useful animation is the build: revealing points or parts of a diagram one at a time as you talk about them, so the audience does not read ahead. It is especially valuable in teaching and in explaining processes.
Smooth transitions that move the same object between slides (PowerPoint’s Morph or Keynote’s Magic Move) can show change and continuity elegantly, and suit launches and premium decks. Use one consistent transition style for the whole deck, keep it short, and avoid spins, bounces, flying text and sound effects; they make a presentation look amateur and slow it down.
Remember that animations disappear in PDFs and printouts. If a slide only makes sense with its builds, design a final state that still reads well when exported.
Arabic and Bilingual Presentations
In our region many presentations are in Arabic or in both Arabic and English, and this needs its own design thinking.
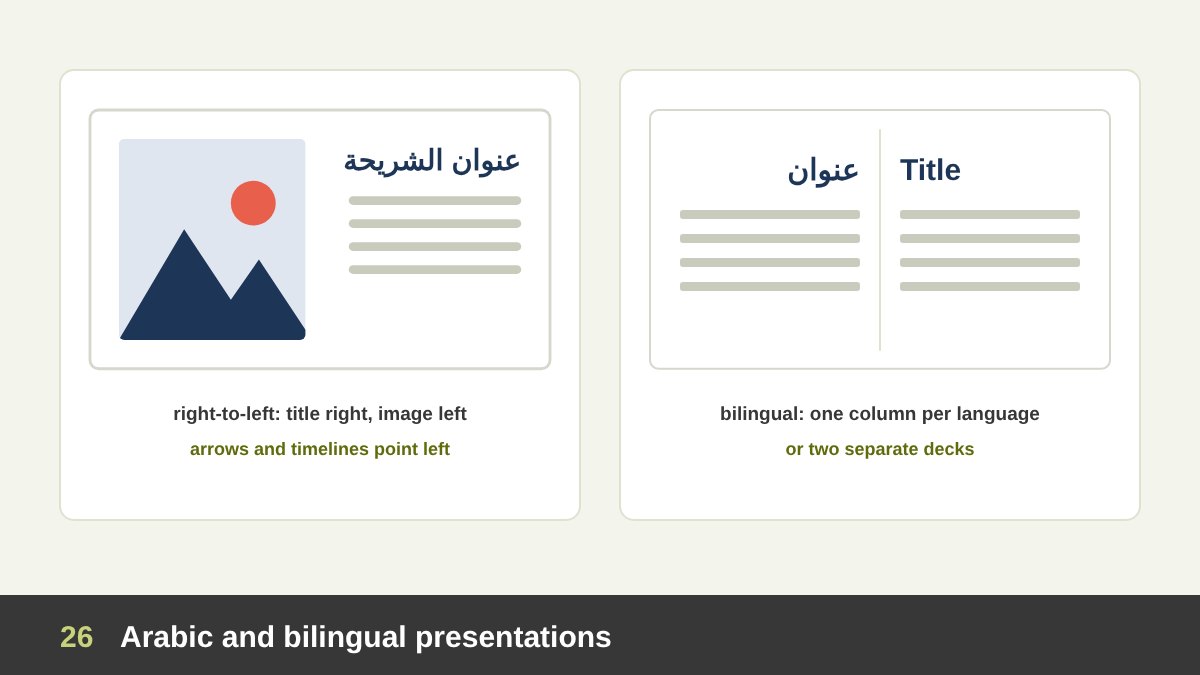
For Arabic decks, mirror the layout: titles and text align right, the reading flow runs from right to left, timelines and process arrows point left, and images usually move to the left side. Choose Arabic typefaces designed for screens with good weights for headlines and text (families such as Almarai, IBM Plex Sans Arabic, Cairo or Noto Kufi Arabic are popular), and pair them with a Latin font of similar weight and character. Arabic text often needs slightly larger sizes than Latin text to read comfortably at a distance.
Decide early whether numbers will appear as Arabic-Indic (١٢٣) or Western (123) digits, and be consistent. Check how your software handles mixed Arabic and English in one line, because brand names, numbers and percentages can jump to the wrong side. For bilingual audiences, two separate decks (or two versions of each slide) usually look cleaner than squeezing both languages onto every slide; when both must appear together, give each language its own consistent column and size.
Online and Hybrid Presentations
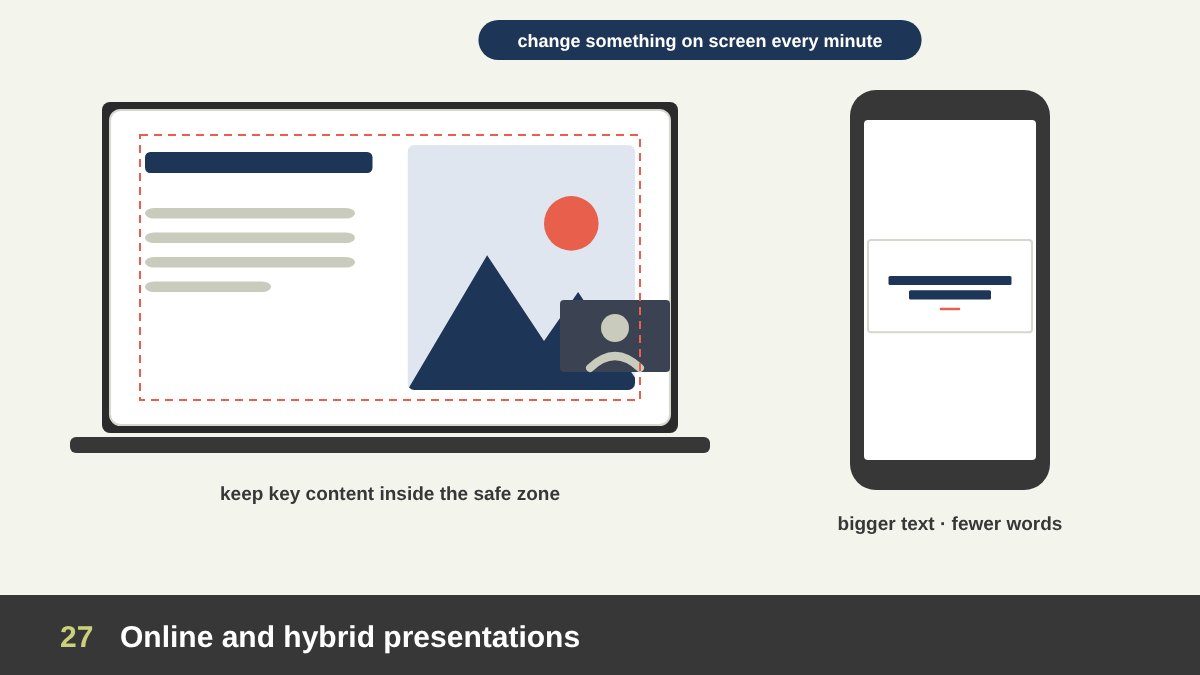
Online audiences see your slides small, often on a laptop or a phone, with notifications and other tabs competing for attention.
Design accordingly: use larger text and fewer words, keep important content away from the corners where the speaker’s video tile or the meeting controls may cover it, and use high contrast. Change something on screen every minute or so (a new slide, a build, a highlight), because attention drops faster when the audience is alone at a desk. Interaction helps: polls, questions in the chat, short exercises.
For hybrid meetings, design for the remote viewers first; people in the room can always see a big screen. Share the deck as a PDF afterwards, and if the presentation is recorded, add captions where possible for accessibility.
Speaker Notes, Handouts and Rehearsal
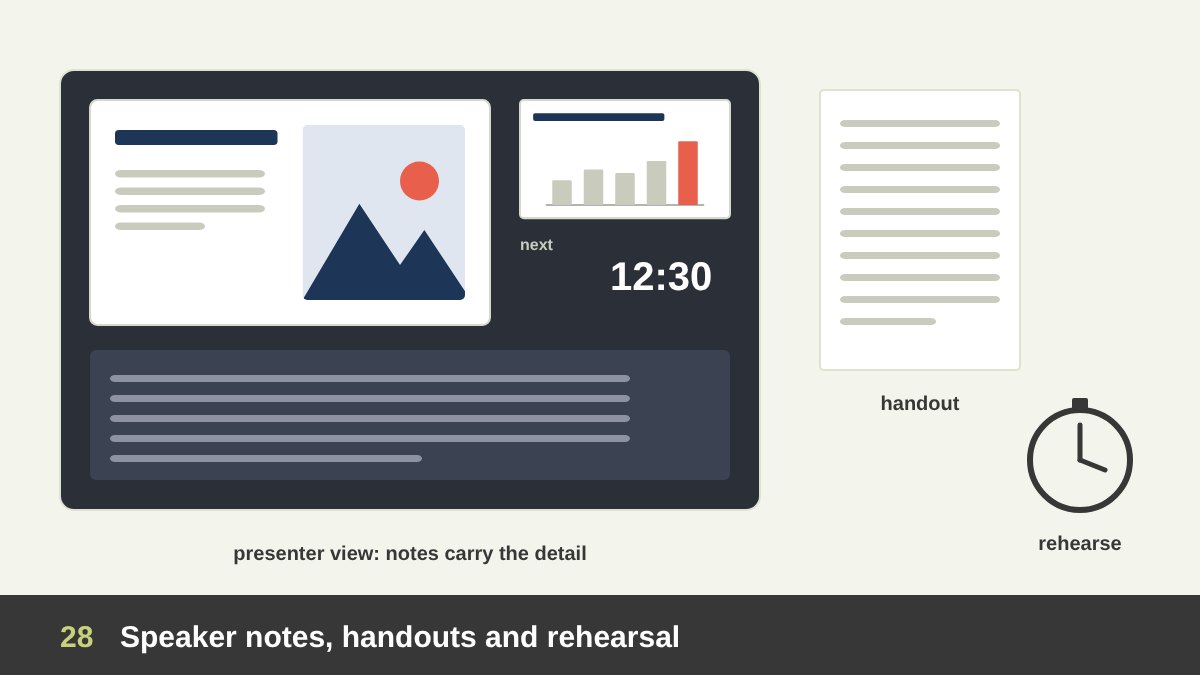
Design does not end with the slides. Speaker notes are where the detail belongs: the full explanation, the numbers you want to quote, the stories. With notes in presenter view, the slides can stay light. Handouts or a leave-behind PDF carry what the audience needs to keep.
Rehearse with the slides, aloud and with a timer. Rehearsal reveals slides that are too dense, transitions that feel slow and sections that run long. A common planning range is one to two minutes per content slide, but methods like PechaKucha or Lessig use much faster rhythms; what matters is fitting your time slot with room for questions.
Prepare the delivery too: export a PDF backup, embed or package fonts and videos, check the screen ratio and the connection at the venue, bring adapters and a clicker, and know how the deck looks on the actual screen before the audience arrives.
Presentation Design Tools: From PowerPoint to AI
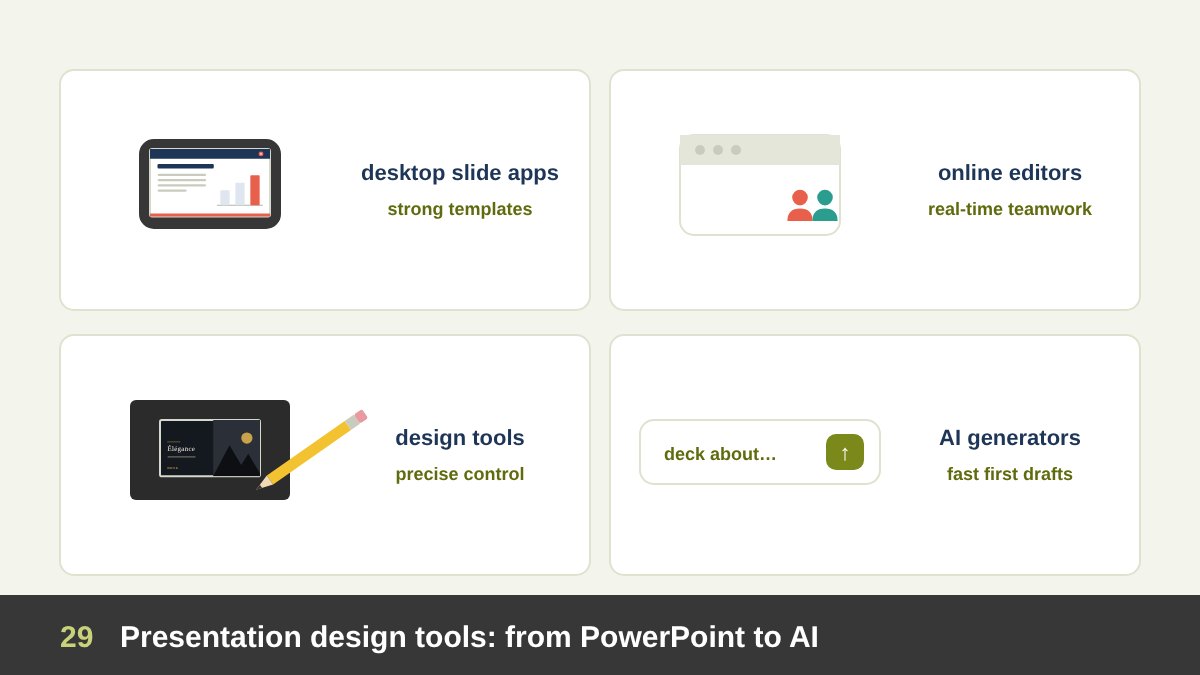
The tool matters less than the thinking, but each has strengths. PowerPoint is the standard in companies and government, with strong master templates, Morph transitions and wide compatibility. Keynote offers elegant typography and transitions on Apple devices. Google Slides is simple and excellent for real-time collaboration.
Canva makes it easy for non-designers to produce attractive slides from templates and brand kits. Figma Slides (launched in 2024) and similar design tools give designers precise control and work well for pitch and portfolio decks. Pitch focuses on collaborative, branded decks; Prezi uses a zooming canvas that can show relationships but can also make audiences dizzy if overused.
AI presentation generators, such as Gamma and the AI features built into the main tools, can turn an outline into a first draft in minutes. They are useful for speed, but they cannot know your audience, your purpose or your brand. Use them for drafts and variations, then apply the thinking in this article: cut, restructure, rewrite headlines as messages and design for the audience.
Common Presentation Design Mistakes
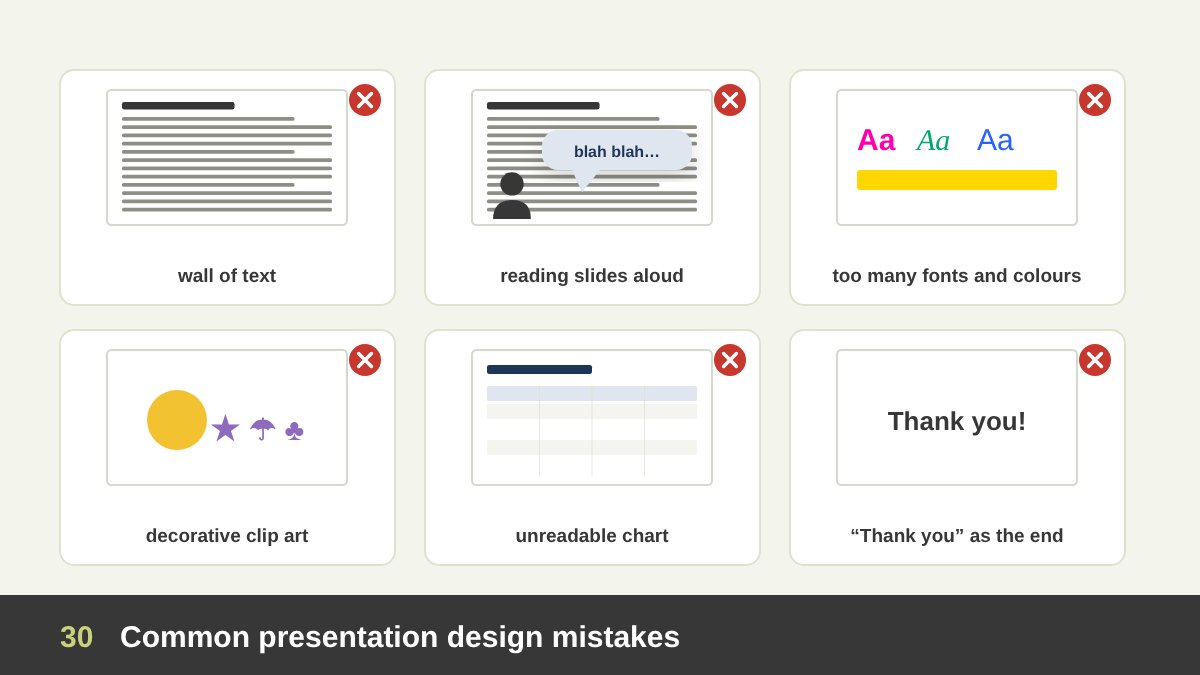
The same mistakes appear in almost every organisation. Walls of text: whole paragraphs on screen that the presenter reads aloud, so the audience reads ahead and stops listening. One deck for every audience: the board, the team and the client see the same slides. Topic titles instead of message headlines: “Results”, “Market”, “Next steps”.
Decoration over meaning: clip art, random icons, stock clichés and effects that explain nothing. Inconsistency: many fonts, colours and title positions. Unreadable data: tiny numbers, 3D charts and tables pasted from spreadsheets. Wrong luxury: gold gradients and ornaments mistaken for elegance, or a luxury style forced onto a training session. Too many slides for the time, so the presenter rushes the end. A closing slide that says only “Thank you”.
Almost all of these come from skipping the four questions at the start. When the purpose, presenter, audience and delivery are clear, most design decisions become obvious.
| Presentation type | Typical presenter and audience | Main goal | Best style | Text on slides | Graphics |
|---|---|---|---|---|---|
| Board or management meeting | CEO or manager to the board | A decision | Data-led, answer first, restrained brand | Medium: action titles and key numbers | Charts only |
| All-hands or internal update | Leader or manager to the team | Understanding and alignment | Simple corporate template, warm photos | Low to medium | Simple icons, timelines |
| Lecture or training | Instructor to students | Learning and memory | Simple, educational, step-by-step builds | Medium, one concept per slide | Diagrams and examples that explain |
| Conference keynote or launch | Leader or speaker to the public | Inspiration or desire | Cinematic, minimal or luxurious | Very low | Large images and video |
| Sales pitch or proposal | Sales or agency to a client | Win the client | Branded, client-centred, premium if the offer is premium | Low live, higher when sent | Mock-ups, proof, case studies |
| Investor pitch | Founder to investors | Investment | Clean, confident, data-backed (10/20/30) | Low to medium | Product shots and key charts |
| Design or creative presentation | Designer to a client | Approval of the work | Editorial or luxurious, work in context | Very low | The work itself, mock-ups |
| Research or academic talk | Researcher to experts | Credibility and understanding | Assertion-evidence, precise | Medium, sentence headlines | Figures, charts, references |
| Report or slidedoc sent by email | Team or company to readers | Documentation | Read-alone, clear grid | High, full sentences | Charts and tables |
| Ceremony, award or wedding | Organiser to guests | Celebration | Elegant, photographic | Very low | Photos, video, motion |
| Exhibition or lobby screen | Brand to passers-by | Attention and recall | Bold, looping, motion | Very low | Motion, product, big type |
Presentation Design Checklist
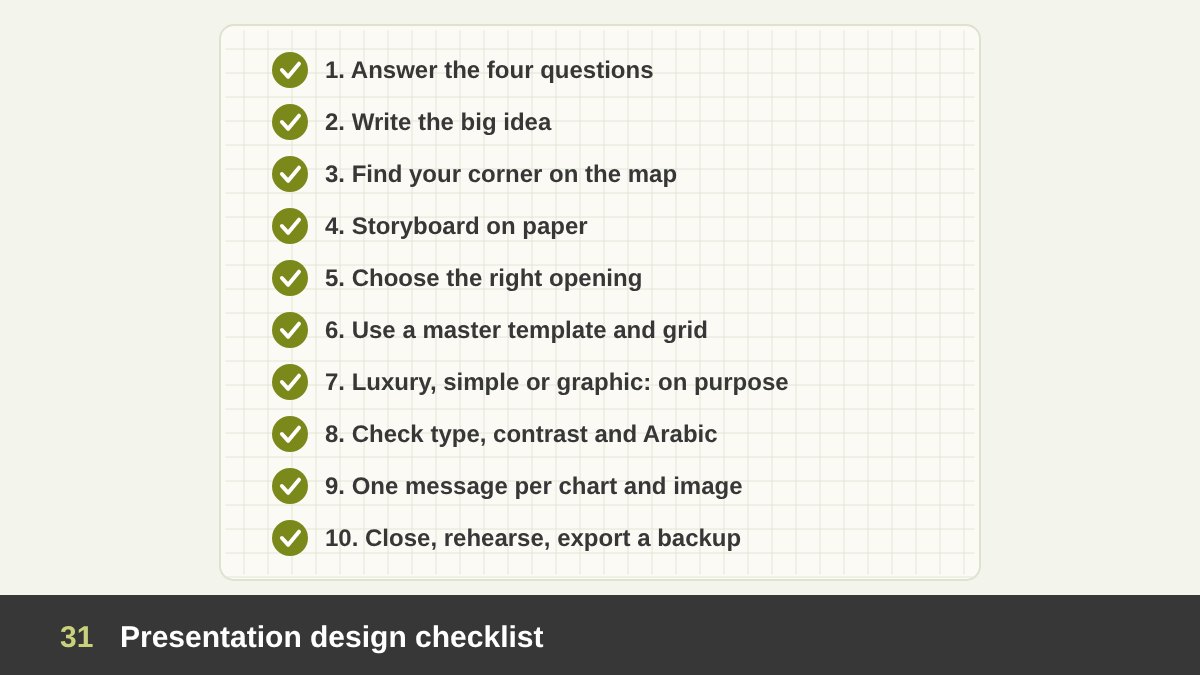
Use this checklist for your next presentation:
1. Answer the four questions: who presents, to whom, why, and how it will be delivered. 2. Write the big idea in one sentence. 3. Choose the corner of the decision map: speaker-led or read-alone, minimal or rich. 4. Outline and storyboard on paper before the software, with one message per slide. 5. Choose the opening that fits the audience: answer first, hook, objectives or the client’s problem. 6. Build or use a master template with the slide types you need, on a grid. 7. Apply the style deliberately: luxurious where the presentation is part of the experience, simple where clarity matters, graphics only where they explain. 8. Check typography sizes, contrast, colour blindness and Arabic layout. 9. Make every chart prove one message and every image earn its place. 10. End with a summary and a call to action, rehearse with a timer, and export a PDF backup.
Presentation design is a quiet skill: when it works, the audience does not notice the slides; they notice the idea. If you need a presentation designed for a launch, a pitch, a report or a training programme, you can see examples in my presentation design portfolio or get in touch.
Presentation Design: Frequently Asked Questions
What is presentation design?
Presentation design is the craft of planning and designing slides, and often the story behind them, so that a presentation achieves its purpose: teaching, informing, persuading, getting a decision, inspiring or reporting. It applies design principles such as hierarchy, contrast, alignment, white space, colour and typography to make one idea at a time easy to understand and remember.
What are the main types of presentations?
By purpose: educational, informative, persuasive or sales, decision, inspirational, report and ceremonial. They can also be classified by who presents (executive, salesperson, designer, instructor, researcher, founder, student), by audience (board, clients, students, experts, public, online), by delivery (live, online, read-alone, printed, self-running) and by visual style (minimal, corporate, luxury, data-led, illustrated, cinematic, typographic, educational).
How many words should be on a slide?
For live presentations, as few as possible: a message headline and a few words or one sentence, with the detail in the speaker notes. A slide should pass the glance test, meaning the audience understands it in about three seconds. Read-alone decks sent as PDFs can contain full sentences and more detail, because no speaker is there to explain.
When should a presentation look luxurious?
When the presentation is part of the experience being sold or the first impression carries high stakes: premium brands, high-value client pitches, launches, investor roadshows for premium companies, ceremonies and creative presentations. Luxury means restraint: space, refined typography, a limited palette and excellent photography, not gold effects and ornaments.
Should a presentation start with an introduction?
Start with a title slide, then open with what the audience needs most: the answer for executives, a hook for keynotes, objectives and an agenda for lessons, and the client’s problem for pitches. A personal or company introduction is useful when credibility matters, but keep it short and place it after you have shown the audience why they should care.
What font size should I use in a presentation?
For live presentations on a 16:9 slide, use about 24 points or larger for body text and roughly 36 to 44 points for titles. Guy Kawasaki recommends no font smaller than 30 points in pitches. Large rooms and online audiences need even bigger type, while read-alone decks can use document sizes.
Leave a Reply