

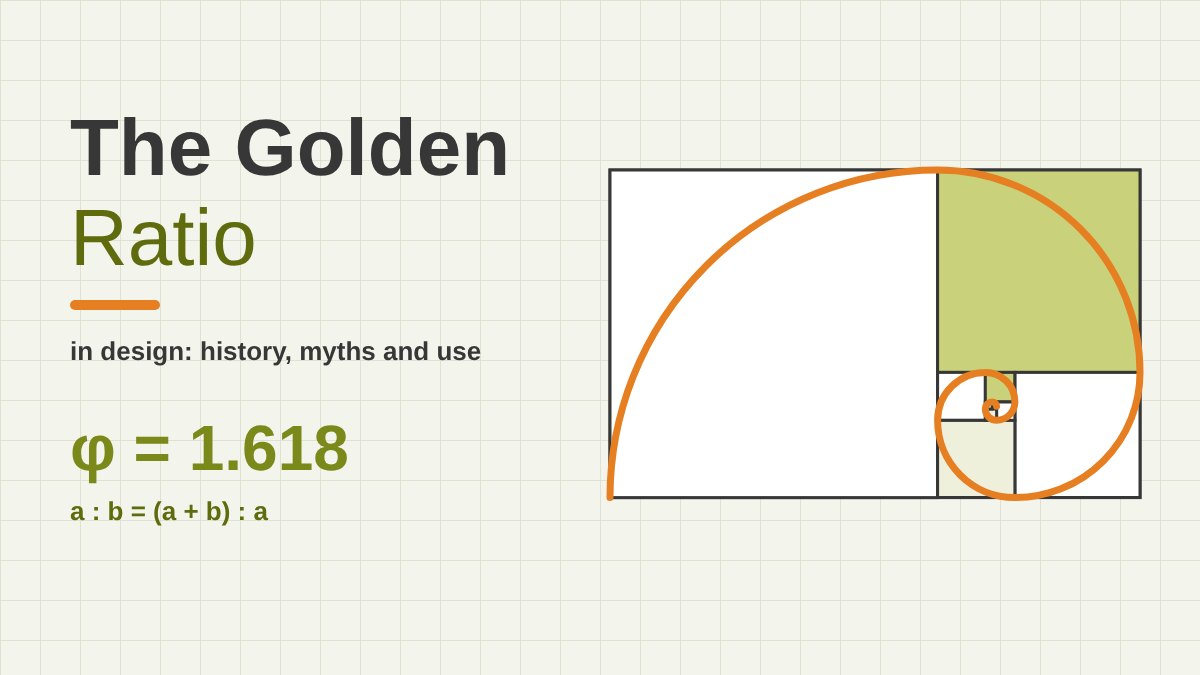
What Is the Golden Ratio?
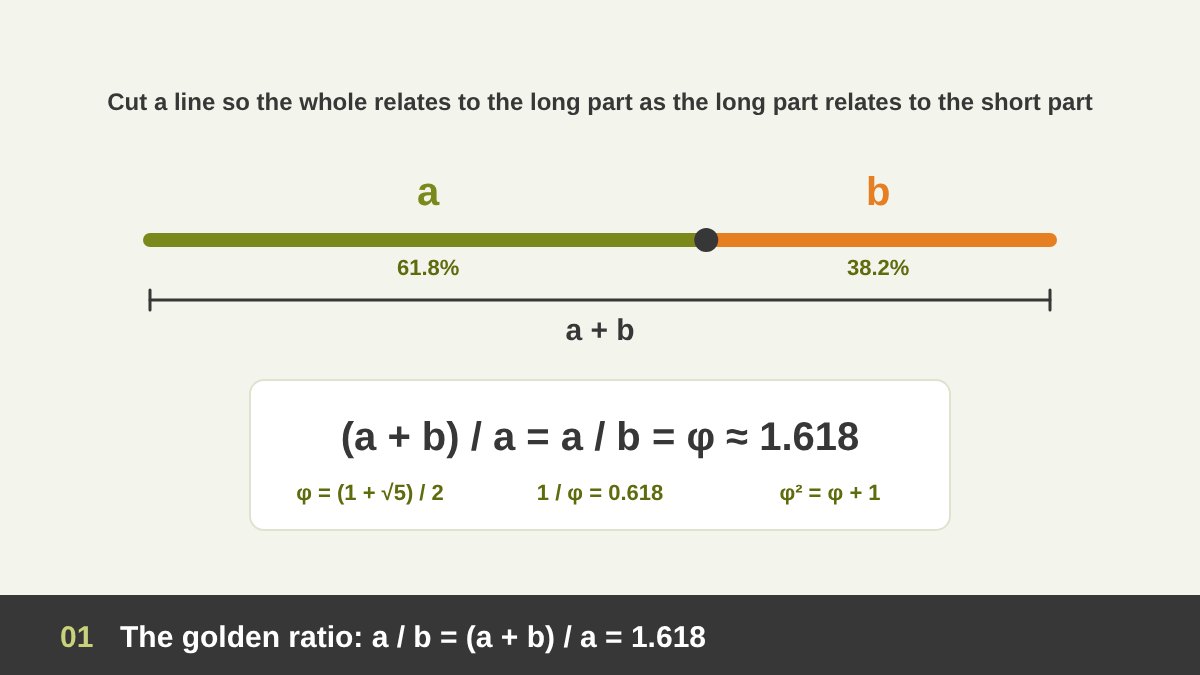
The golden ratio is a special relationship between two sizes. Take a line and cut it into a long part (a) and a short part (b). If the whole line divided by the long part gives exactly the same number as the long part divided by the short part, you have cut it in the golden ratio. That number is always the same: about 1.6180339887…, and it is written with the Greek letter φ (phi).
In mathematical terms, φ = (1 + √5) ÷ 2. It is an irrational number, so its decimals never end or repeat. It also has some unusual properties that explain why mathematicians love it: φ × φ = φ + 1 (2.618), and 1 ÷ φ = φ − 1 (0.618). That last number is why designers often talk about a 62 / 38 split: if the whole is 100, the larger part is about 61.8 and the smaller about 38.2.
In plain design language, the golden ratio is a proportion: a way of making a big thing and a small thing relate to each other, and to the whole, in the same way. I already touched on it briefly under scale and proportion in The Principles of Design; in this article I go deep: what it really is, where it comes from, which famous stories are true and which are not, and how to actually use it in logos, layouts, websites and every field I work in.
Key takeaways
- The golden ratio (φ, phi) is about 1.618. Two parts are in the golden ratio when the whole divided by the larger part equals the larger part divided by the smaller part.
- Nobody “invented” it and no single person discovered it. Euclid gave the first written definition around 300 BC, calling it the “extreme and mean ratio”. Fibonacci (1202) gave us the number sequence that approaches it, Luca Pacioli (1509) called it the “divine proportion”, and the name “golden section” only appears in the 1830s.
- Many famous claims are myths: there is no solid evidence that the pyramids, the Parthenon, the Mona Lisa or the Apple logo were designed with it, and the nautilus shell is not a golden spiral. Sunflower seed heads, Le Corbusier’s Modulor and Dalí’s Last Supper are real examples.
- For designers it is a tool, not a law: a ready-made proportion system that helps you decide sizes, splits, spacing and type scales quickly and consistently.
- You can use it in every field: a 62/38 layout split, a ×1.618 type scale, logos built from circles in Fibonacci sizes, the phi grid in photography and painting, slide layouts, packaging and exhibition panels. Use it to start or to check your work, then trust your eye.
The Golden Rectangle, Golden Spiral and Golden Triangle
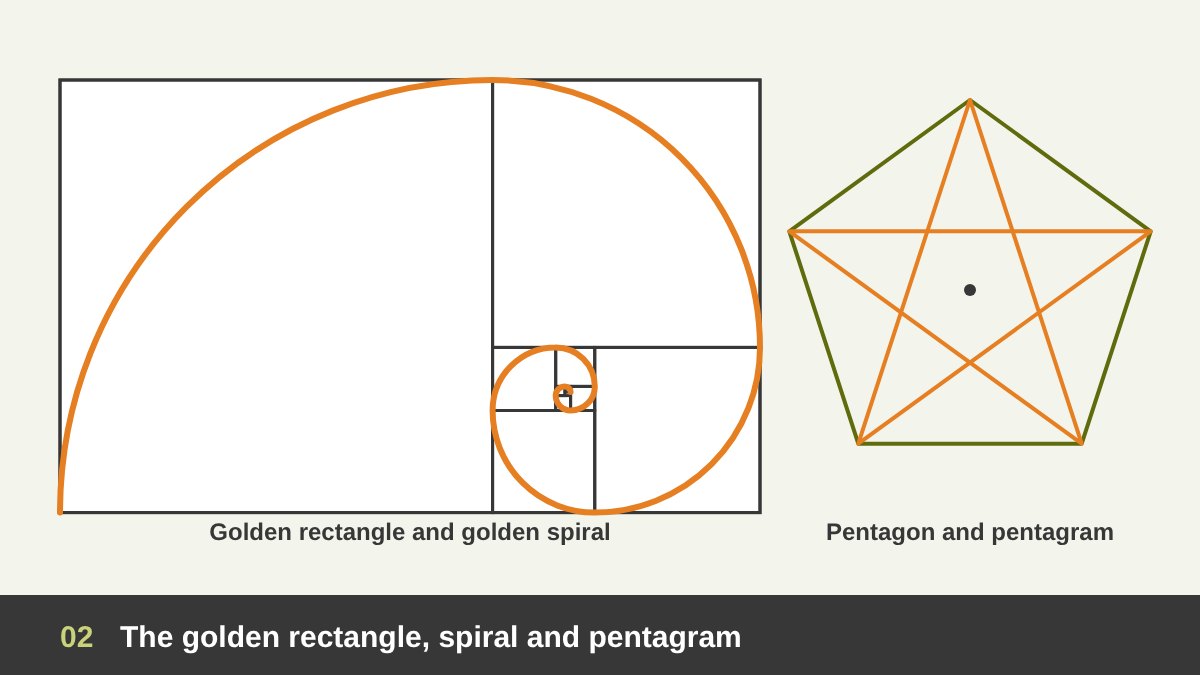
Designers rarely use φ as a number on its own; they use the shapes built from it. The most famous is the golden rectangle, whose long side is 1.618 times its short side. Its special property: if you cut a square off one end, the piece left over is another, smaller golden rectangle. You can repeat that forever, and each new rectangle turns a quarter of the way around.
If you draw a quarter circle inside each of those squares, you get the golden spiral, the curly line that appears on thousands of posters and “golden ratio overlays”. Strictly speaking, that drawing is an approximation: the true golden spiral is a logarithmic spiral that grows by a factor of φ every quarter turn, and the square-and-arc version is close to it. A similar drawing made from squares with Fibonacci sides (1, 1, 2, 3, 5, 8…) is called the Fibonacci spiral.
The ratio also hides inside the regular pentagon and the five-pointed star (pentagram): every diagonal of a regular pentagon is φ times its side, and the lines of the star cut each other in the golden ratio. The tall thin triangles at the star’s points are called golden triangles. This is important for the history, because the pentagon is probably where the ancient Greeks first met the ratio.
Who Discovered the Golden Ratio? The Greek Origins
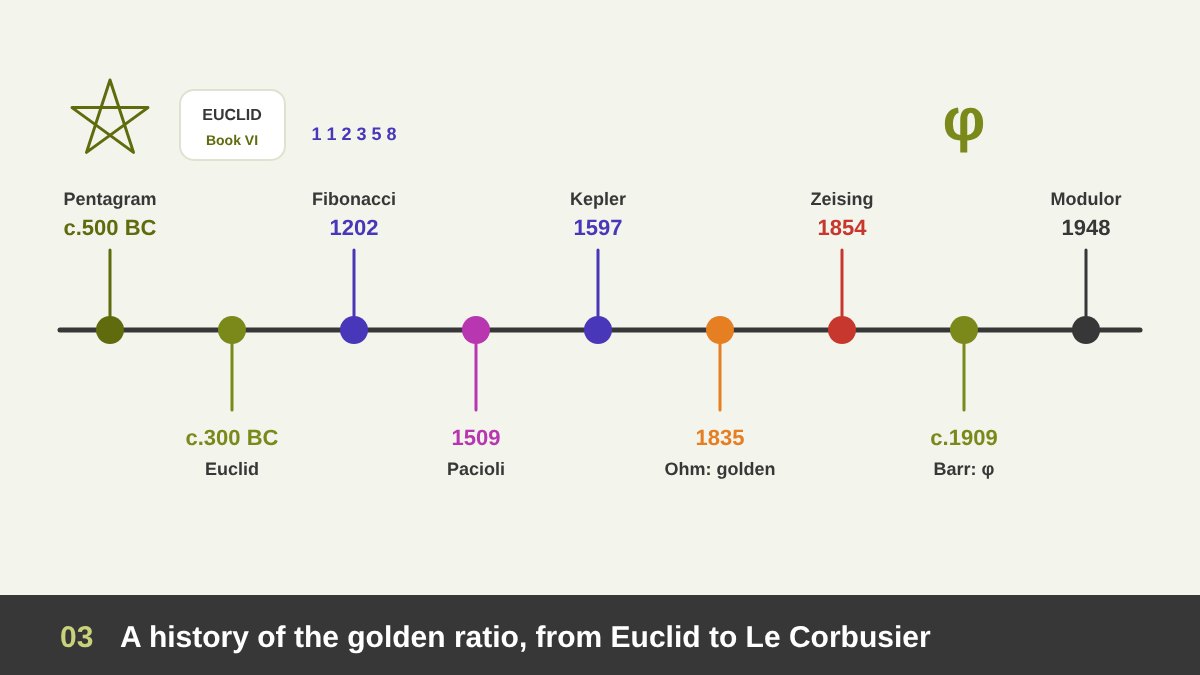
The honest answer is that no single person discovered the golden ratio. It is a property of geometry, and many people found it while studying shapes. The earliest clear source we have is Euclid’s Elements, written in Alexandria in about 300 BC. In Book VI Euclid defines how to cut a line in “extreme and mean ratio”, which is exactly the golden ratio, and he uses it to construct the regular pentagon and some regular solids.
Euclid was collecting and organising work by earlier Greek mathematicians, so the idea is older than his book. Historians often link it to the Pythagoreans, who used the pentagram as their symbol, and to mathematicians such as Theaetetus and Eudoxus in the 4th century BC, but the details are uncertain because their own writings are lost. What we can say is that the Greeks treated it as a problem of geometry, not of beauty. There is no Greek text that calls it the secret of beautiful art or architecture.
After the Greeks, the ratio was studied by mathematicians across the medieval world. Scholars writing in Arabic, such as Abu Kamil in Egypt (10th century), worked on problems involving pentagons and decagons that use the same proportion, and their work later travelled to Europe, where it helped shape what came next.
Fibonacci and the Famous Number Sequence
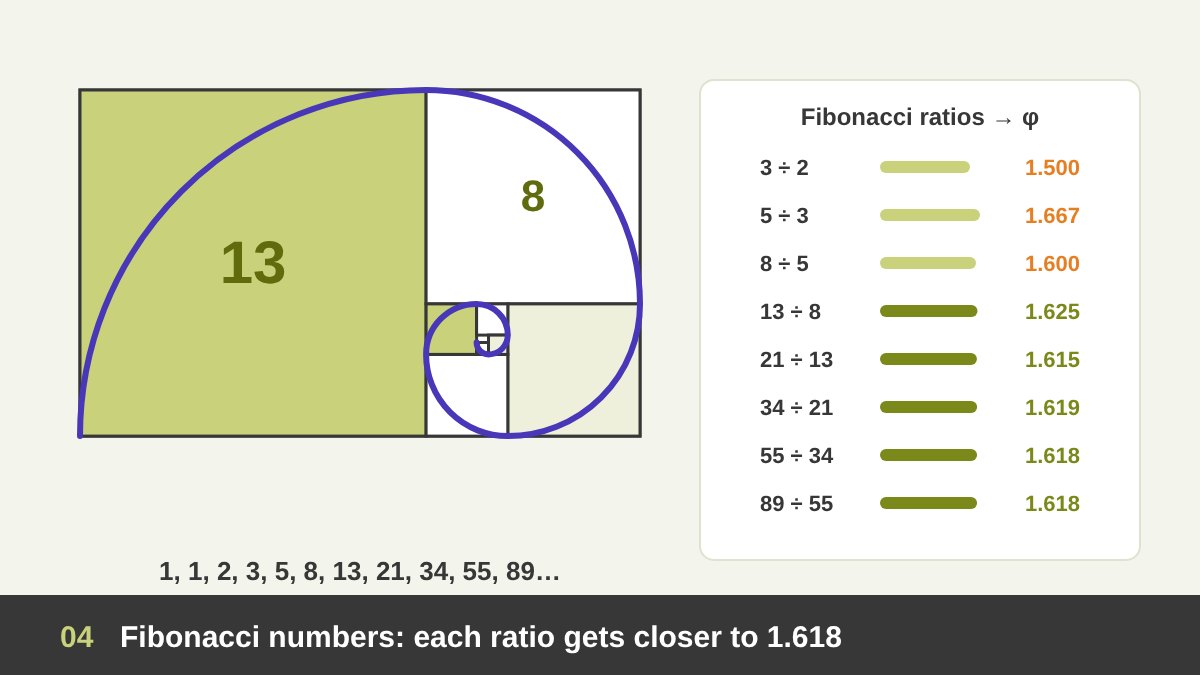
In 1202, the Italian mathematician Leonardo of Pisa, known today as Fibonacci, published Liber Abaci, the book that helped bring Hindu–Arabic numerals (the digits we use today) to Europe, which he had learned while living in North Africa. In it he included a puzzle about breeding rabbits whose answer is the sequence 1, 1, 2, 3, 5, 8, 13, 21, 34, 55, 89…, where each number is the sum of the two before it. Indian scholars of poetry and rhythm, such as Virahanka and Hemachandra, had described the same sequence centuries earlier.
Fibonacci himself did not connect the sequence to the golden ratio. That connection was noticed later, and is usually credited to Johannes Kepler (around 1597–1611): if you divide each Fibonacci number by the one before it, the answer gets closer and closer to φ. 5 ÷ 3 = 1.667, 8 ÷ 5 = 1.6, 13 ÷ 8 = 1.625, 21 ÷ 13 = 1.615, 89 ÷ 55 = 1.618. Kepler admired it so much that he called the division in extreme and mean ratio one of the two great treasures of geometry, next to the Pythagorean theorem.
For designers this link is very practical. Fibonacci numbers are whole numbers close to the golden ratio, so they make perfect sizes for circles in a logo grid, spacing values, font sizes or column widths: 8, 13, 21, 34, 55, 89 pixels. You get golden proportions without decimals.
The “Divine Proportion”: Pacioli and Leonardo da Vinci
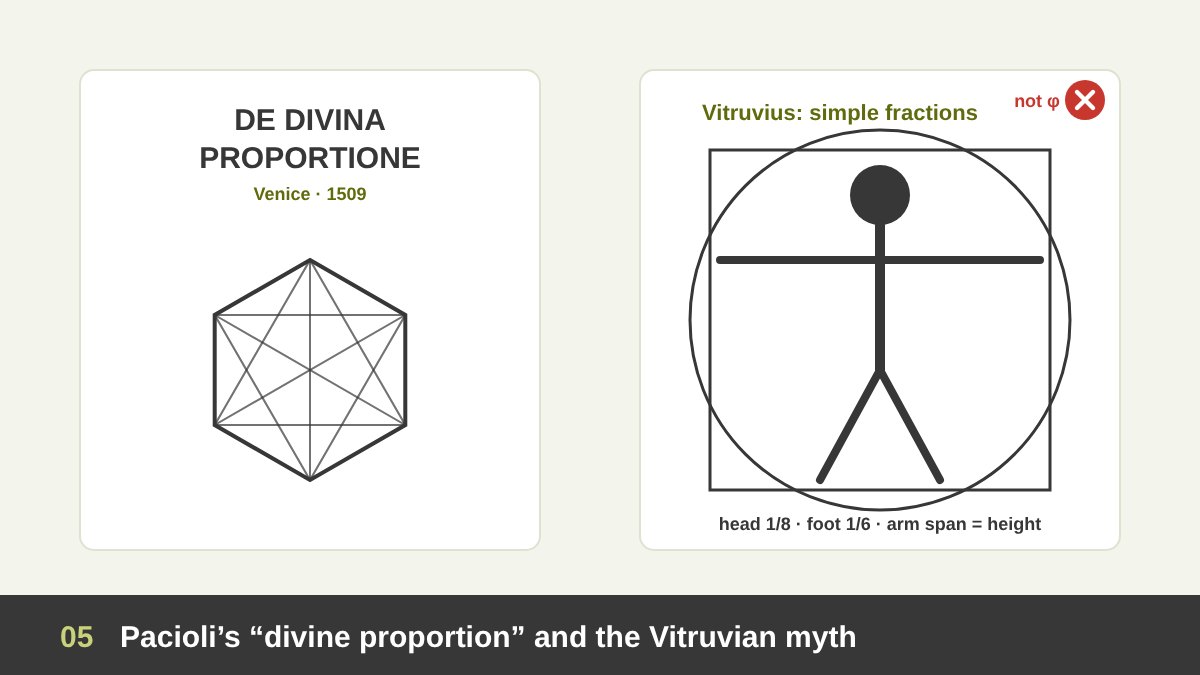
The ratio got its first romantic name in 1509, when the Franciscan friar and mathematician Luca Pacioli published De Divina Proportione (“On the Divine Proportion”) in Venice. Pacioli saw something sacred in a number that is unique and cannot be expressed as a simple fraction, and he compared it to the qualities of God. His book was illustrated with beautiful drawings of geometric solids by his friend Leonardo da Vinci.
This is where an important myth begins. Because Leonardo illustrated that book, many people assume he used the golden ratio in his paintings. There is no good evidence for that. His famous Vitruvian Man (around 1490) follows the proportions described by the Roman architect Vitruvius, which use simple fractions (the head is one eighth of the height, the foot one sixth, and so on), not φ. Pacioli himself recommended Vitruvius’s simple ratios for architecture.
Renaissance artists certainly used geometry and proportion systems to compose their paintings, and some of them knew this ratio. But “used geometry” is not the same as “used the golden ratio”, and most of the golden spirals you see drawn over Renaissance paintings online were added centuries later.
How It Got the Name “Golden”
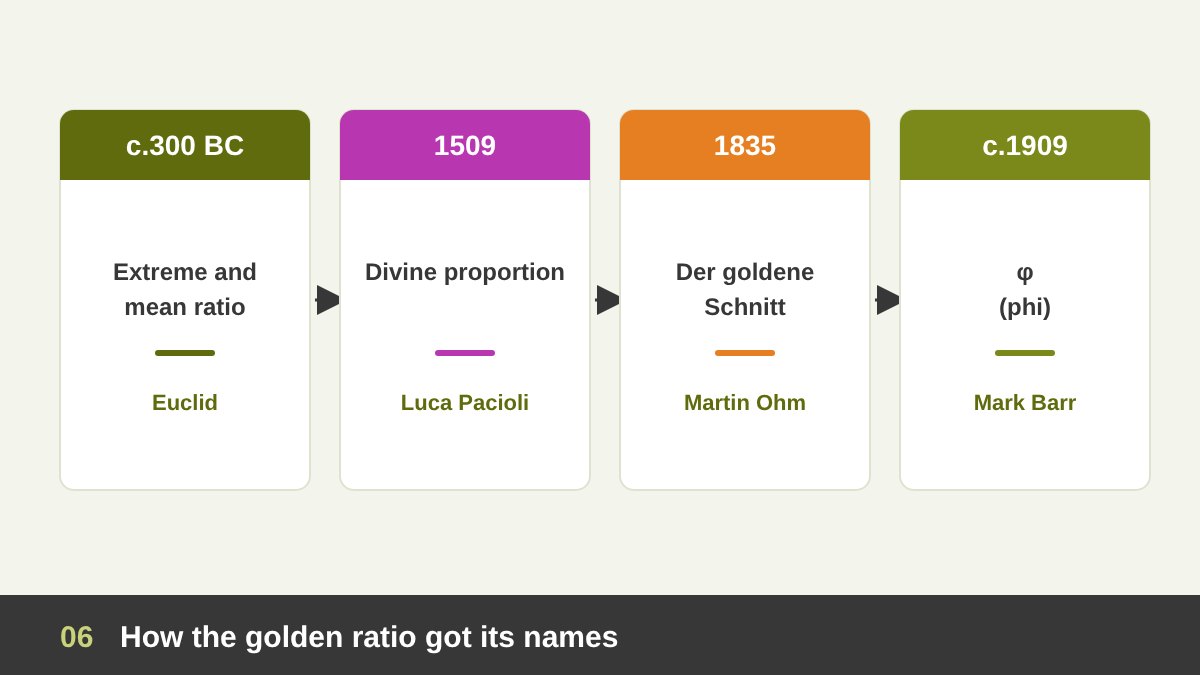
The word “golden” is surprisingly modern. The first known use is in a German mathematics textbook by Martin Ohm (brother of the physicist Georg Ohm) in 1835, who called it der goldene Schnitt, “the golden section”. The name spread quickly in German and then in English during the 19th century, and “golden ratio” and “golden mean” followed.
In 1854 the German writer Adolf Zeising made it famous far beyond mathematics. He claimed the golden section was a universal law of beauty found in the human body, plants, animals, music and great architecture. Much of the golden ratio “mysticism” we still read online starts with Zeising, and many of his measurements were chosen to fit his theory. In 1876 the psychologist Gustav Fechner tested whether people prefer golden rectangles; his results seemed to say yes, but later studies have given mixed results, and today there is no strong evidence that people reliably prefer φ over nearby ratios.
The symbol φ (phi) came even later. The American mathematician Mark Barr proposed it in the early 20th century, reportedly in honour of the Greek sculptor Phidias; it was published in Theodore Cook’s book The Curves of Life in 1914. So the name and the letter that make the golden ratio sound ancient are barely a hundred and fifty years old.
Golden Ratio Myths and Facts
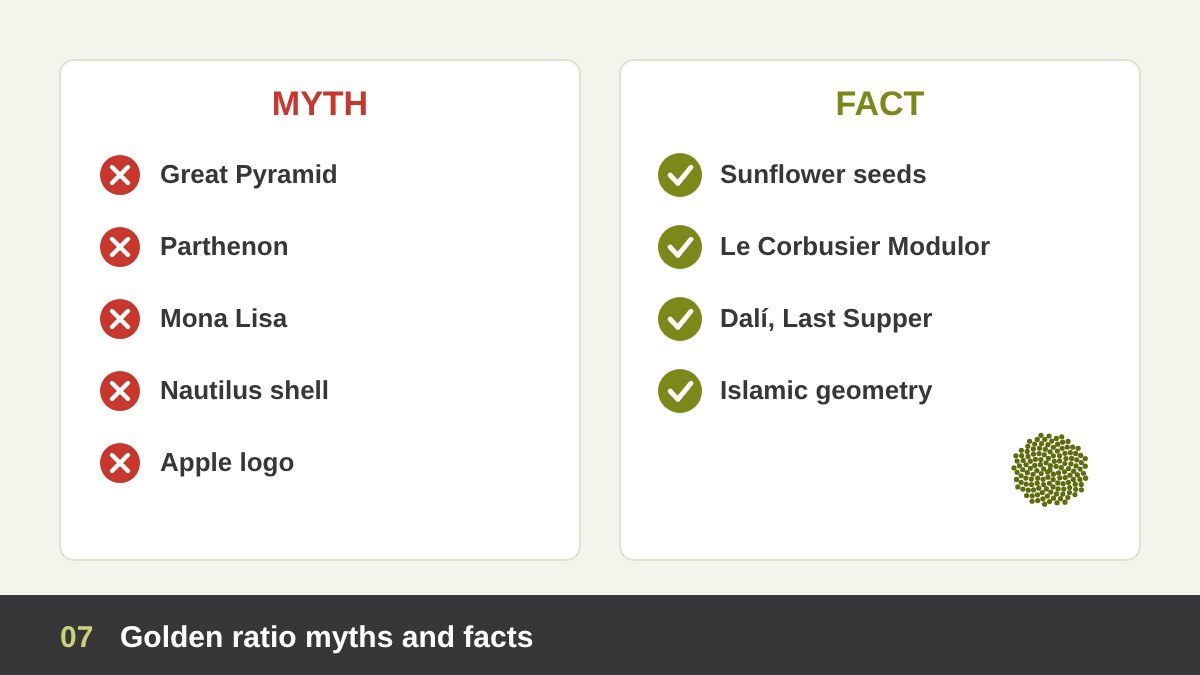
The golden ratio is surrounded by more myths than any other idea in design, so it is worth separating them clearly. Myth: the Great Pyramid of Giza was built on φ. One ratio of the pyramid comes close to it, but that is most likely a side effect of the slope the builders chose, and no Egyptian text mentions the ratio. Myth: the Parthenon was designed with it. It was built in the 5th century BC, before Euclid, and when you measure it carefully the golden rectangles drawn over it do not fit without choosing the points conveniently. Myth: the Mona Lisa and the Vitruvian Man. As we saw, there is no evidence for either.
Myth: the nautilus shell is a golden spiral. The nautilus grows in a beautiful logarithmic spiral, but measurements show its growth rate is quite different from φ. Myth: the “perfect” human face and body follow φ. Bodies vary a lot, and with enough points you can find 1.6 somewhere in almost anything. Myth: it is the most beautiful proportion. As mentioned above, research does not support a single “most beautiful” ratio.
Now the facts. In nature, the seeds of a sunflower, the scales of a pine cone and the leaves around many stems are arranged by the golden angle (about 137.5°, derived from φ), which is why the spirals you can count are usually Fibonacci numbers such as 34 and 55. In architecture, Le Corbusier deliberately built his Modulor system (1948) on the golden ratio and the human body. In art, Salvador Dalí painted The Sacrament of the Last Supper (1955) on a canvas close to a golden rectangle, with a huge dodecahedron, a solid tied to φ, above the table. And in Islamic geometric art, patterns with five- and ten-fold stars, such as the girih tile patterns of the 15th-century Darb-i Imam shrine in Isfahan, are full of golden proportions because they are built on pentagons and decagons.
Why Designers Still Use the Golden Ratio
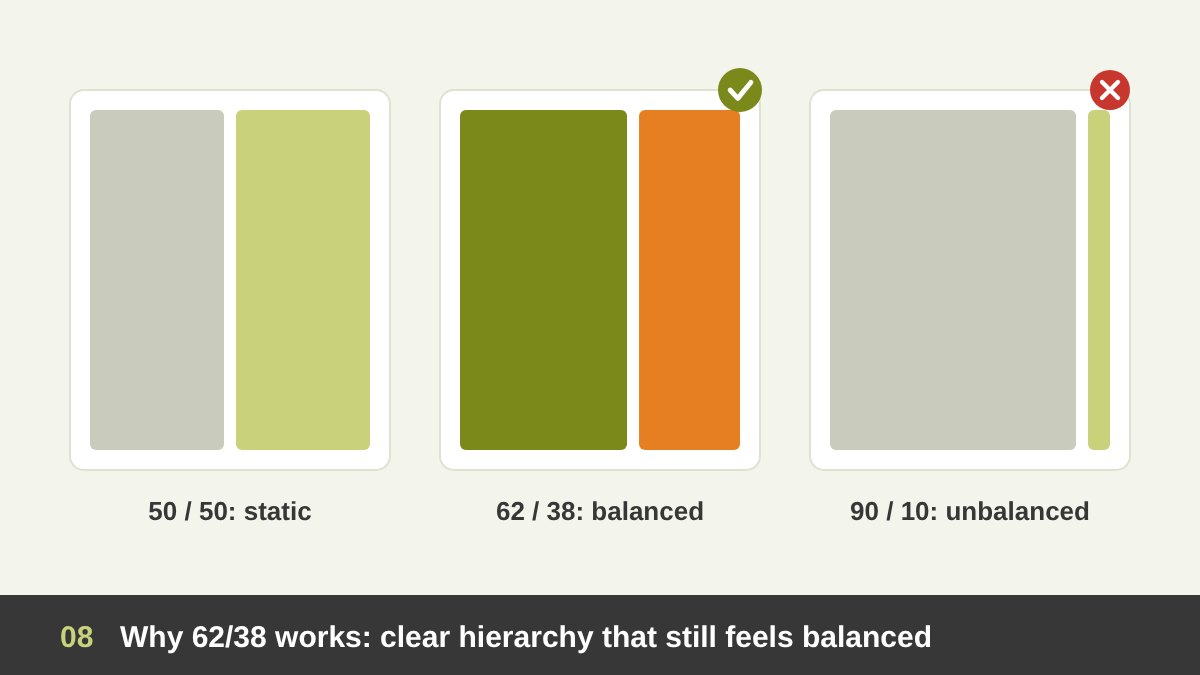
If the golden ratio is not a magic law of beauty, why do designers still use it? Because design is made of hundreds of decisions about size: how big the headline is compared to the text, how wide the image is compared to the column, how much space goes above a title and how much below. Without a system, those decisions become random, and random proportions look messy even when each element is beautiful. The golden ratio gives you a ready-made, consistent system that repeats at every scale.
Visually, the 62/38 split works well because it is clearly unequal without being extreme. A 50/50 split is calm but static, because the eye does not know which side is more important. A 90/10 split feels unbalanced. Something around 60/40 creates a clear hierarchy (one part leads, the other supports) while still feeling balanced. That is why the golden ratio, the rule of thirds (66/33) and simple ratios like 3:2 all look good: they are neighbours.
So my advice is to think of φ the way a musician thinks of a scale. It does not write the song for you, but it gives the notes a relationship to each other. Used as a starting point and a check, it makes your work more harmonious and faster to decide. Used as a religion, it wastes time and can make you ignore what your eye and your client actually need.
The Golden Ratio in Graphic Design and Layout
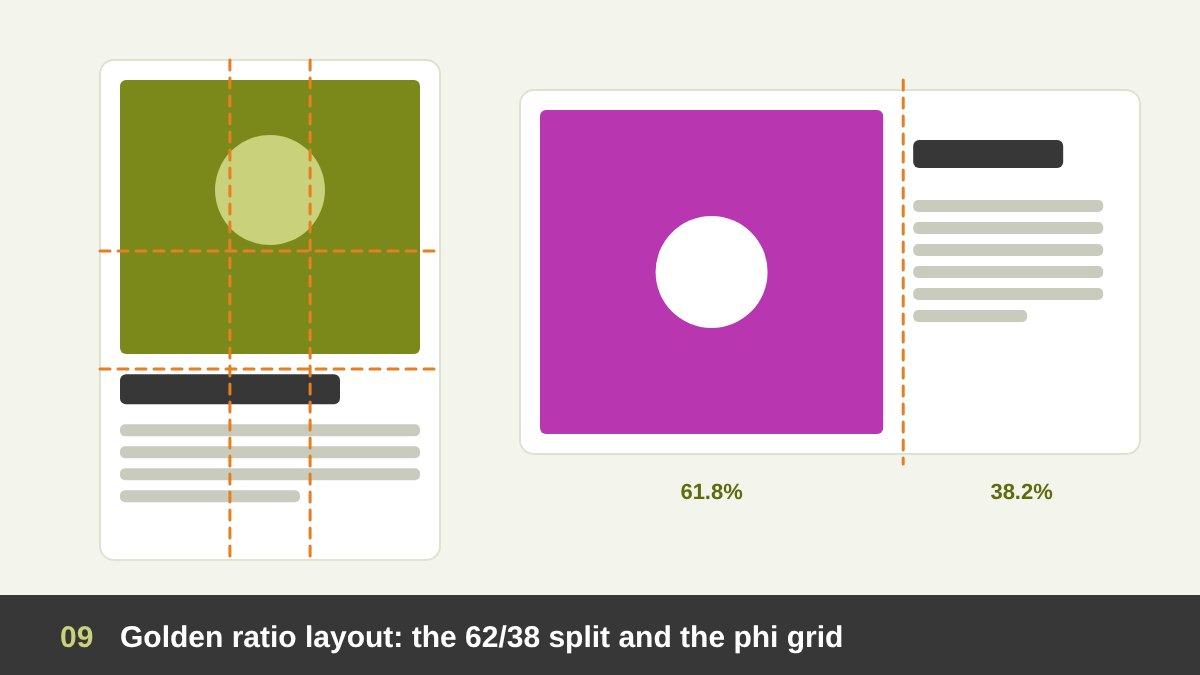
The easiest way to use the golden ratio in graphic design is to split your space 62/38. Divide the width of a poster, flyer, brochure page or banner at 61.8% and you get a natural place for the boundary between the image and the text, or between the main column and the side column. Do the same with the height and you get a natural position for the horizon line, the headline or the main visual. The resulting lines, at 38.2% and 61.8% in both directions, are called the phi grid: four lines and four strong intersection points, slightly closer to the centre than the rule of thirds.
You can also use the golden rectangle as the shape of a format. Many designers like formats close to 1:1.618 for posters, cards and covers, but be careful with this one in print: standard paper sizes are not golden. A4 and the other ISO sizes use the ratio √2 (1:1.414) so they can be folded in half and keep the same shape. In practice you design on the paper you have and use the golden ratio inside it, for the image area, the text block and the margins.
For books and magazines, the golden ratio has a long history in page proportion and margins. The typographer Jan Tschichold studied medieval manuscripts and showed how their designers used harmonious page and text-block proportions, including the golden section, to make pages that feel calm and readable. A simple modern version: make the bottom margin larger than the top, and the outer margin larger than the inner, so the text block sits slightly high and towards the spine.
How to Use the Golden Ratio in Logo Design, Step by Step
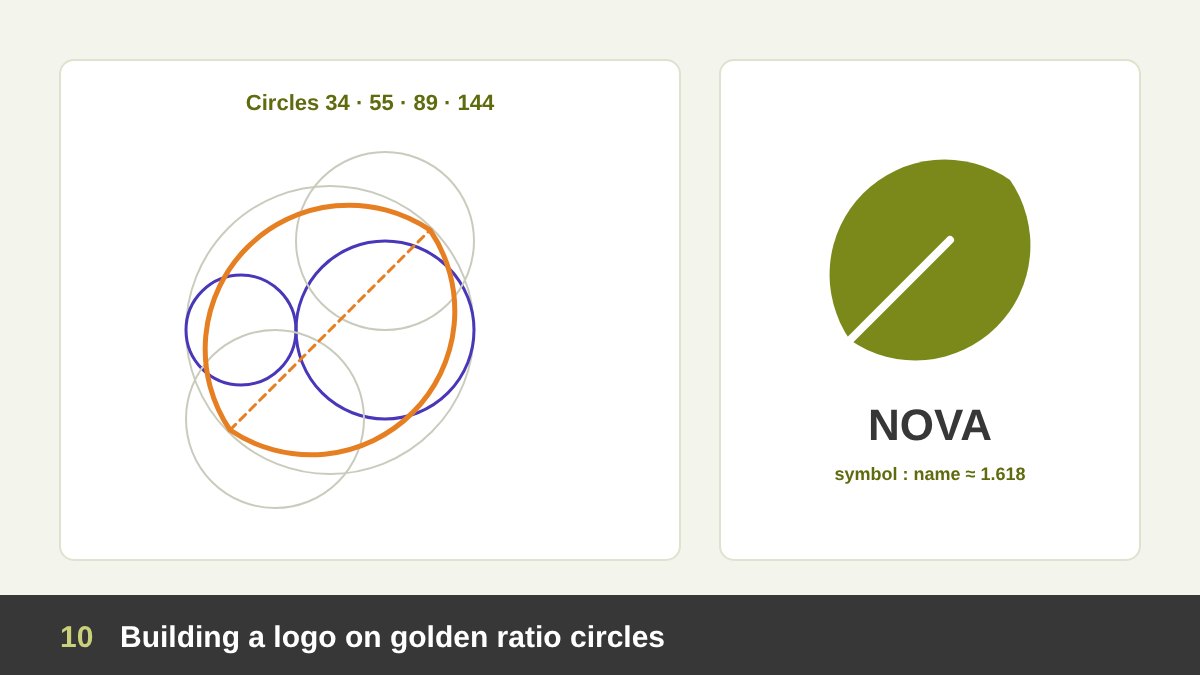
In logo design, the golden ratio is used to build the construction grid: the set of circles and lines a designer uses to draw curves and decide proportions. The most common method is to create a series of circles whose sizes follow φ (or the Fibonacci sequence): for example diameters of 13, 21, 34, 55 and 89 units, or 1, 1.618, 2.618 and 4.236. Because every circle relates to the others by the same ratio, the curves you take from them feel related too.
Here is the step-by-step process I recommend. 1. Start with the idea, not the grid. Sketch the concept by hand first, as I explain in Good Logo Design; no grid can save a weak idea. 2. Build the circle set in Illustrator (or Figma): draw circles in golden sizes and keep them on a locked layer. 3. Rebuild your sketch by moving and overlapping the circles until their arcs trace the curves of your mark; use the Shape Builder tool to keep the parts you need. 4. Use the ratio for proportions too: the height of the symbol versus the wordmark, the thickness of strokes, the gap between symbol and name. 5. Check it at small sizes and in one colour, and adjust by eye where the maths looks wrong; optical corrections always win.
The real benefit is consistency and a clear story. A mark built on related curves looks deliberate, and showing the construction grid in your presentation helps clients understand the craft behind the logo, which supports the price. Just be honest: show the grid you really used, not one drawn over the logo afterwards. And remember that a logo is only part of a brand, as I explain in Branding vs Logo Design.
Famous Logos and the Golden Ratio: What Is True and What Is Not
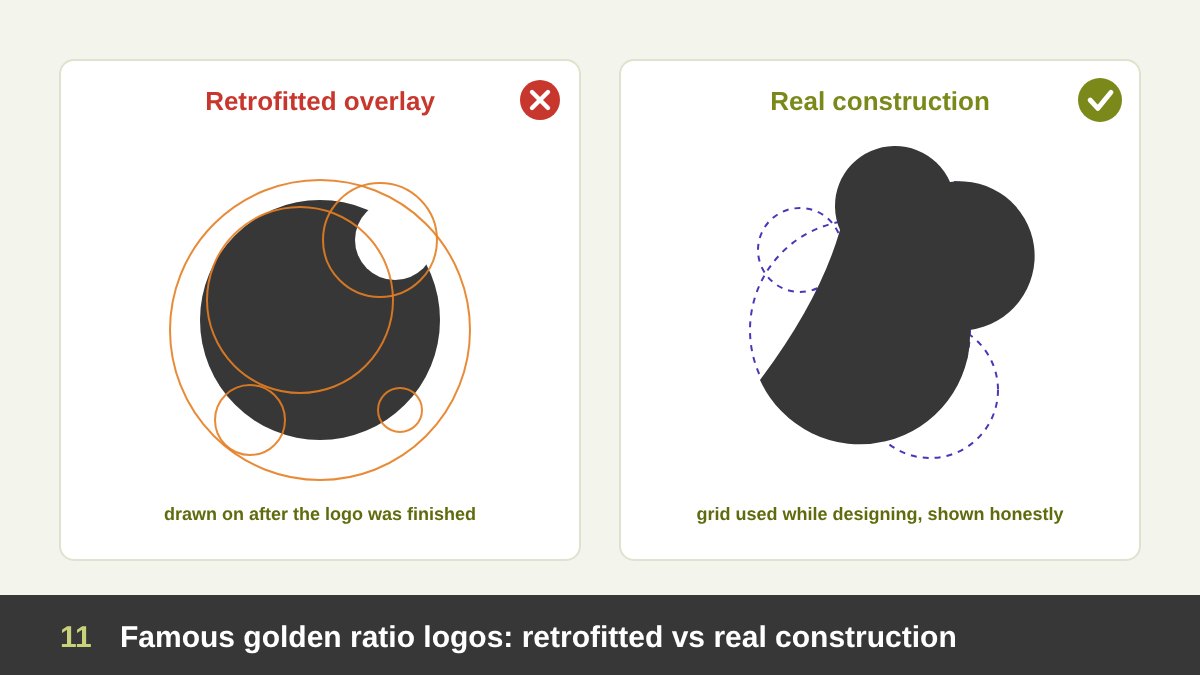
Search “golden ratio logos” and you will find the same examples again and again, with circles drawn over them. Some deserve a closer look. The Apple logo is the most shared one: an image with golden circles laid over the apple went viral around 2010. But the logo was designed in 1977 by Rob Janoff, who has described basing its shape on real apples he bought and sketched. There is no record of a golden ratio grid from that time; the circles were fitted over the logo decades later by someone else. It is a beautiful logo because of its idea and its simplicity, not because of φ.
The Twitter bird (2012) is a more interesting case. Twitter’s creative director Doug Bowman explained at launch that the new bird was built from overlapping circles, and the team showed that construction, which is a genuine example of circle-based logo construction. The popular claim that those circles follow the golden ratio came mainly from designers analysing it afterwards. Pepsi’s 2008 redesign is the cautionary tale: a leaked strategy document from the agency linked the new “smile” globe to the golden ratio, the Mona Lisa, the Parthenon and even the theory of relativity, and the design community made fun of it for years. Golden ratio talk cannot replace a real idea.
Other logos often mentioned include Toyota, National Geographic, BP and iCloud. For most of them, there is no public statement from the designers, so treat the overlays as interesting analysis, not history. The lesson for us is simple: use the golden ratio as a construction tool if it helps you, document it honestly, and never use it as a selling story for a logo that does not work on its own.
The Golden Ratio in Typography
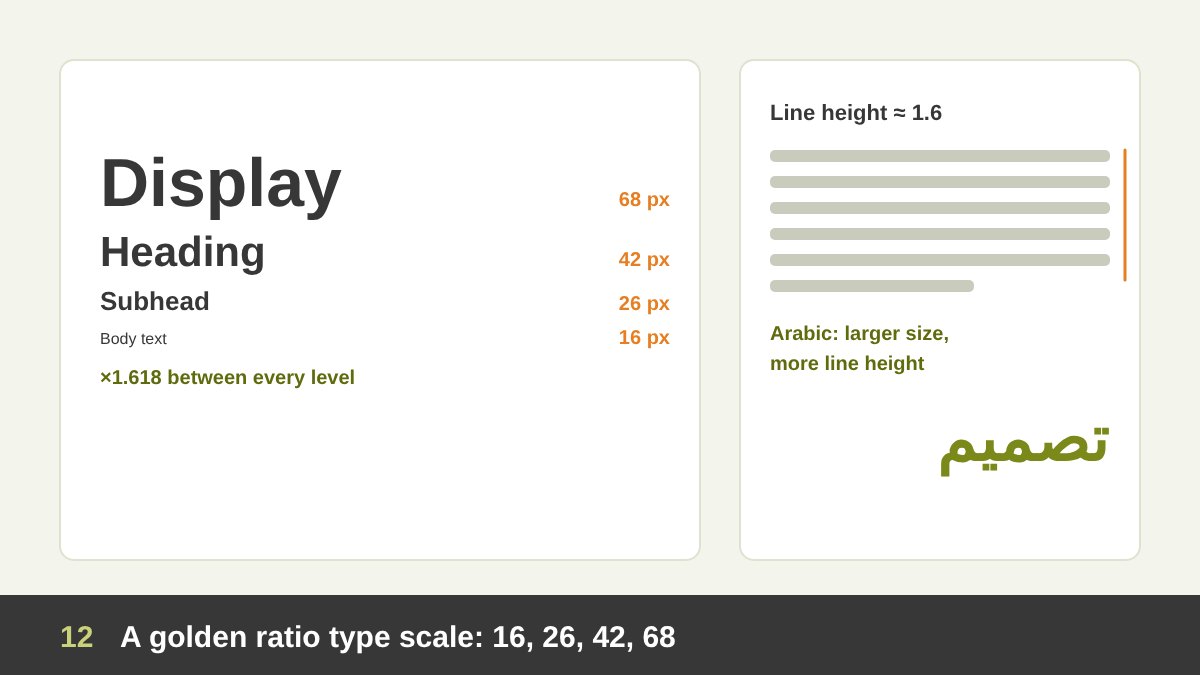
Typography is one of the most useful places for the golden ratio, because it gives you a type scale: a set of font sizes that relate to each other. Start with your body size and multiply by 1.618 for each level up. With 16 px body text you get about 16 → 26 → 42 → 68 px; with 10 pt in print you get 10 → 16 → 26 → 42 pt. Your headings, subheadings and body then belong to one family of sizes instead of random numbers.
Be aware that φ is a large step. It is perfect for posters, covers, presentations and hero sections, where you want strong contrast, but for long articles and dense interfaces many designers prefer smaller ratios such as 1.25 or 1.333, and use 1.618 only between the biggest levels. Some designers also use φ for line height (16 px text with about 26 px line height is very comfortable to read) and to relate line height to line length.
For Arabic typography, the logic is the same but the numbers need adjusting. Arabic letters have a different x-height, more vertical movement and many dots and marks, so Arabic text usually needs a slightly larger size and more line height than Latin text at the same point size. Traditional Arabic calligraphy has its own proportion system, based on the rhombic dot (nuqta) standardised by Ibn Muqla in the 10th century, not on φ, and it is worth respecting when you pair Arabic and Latin type.
The Golden Ratio in Website and UI/UX Design
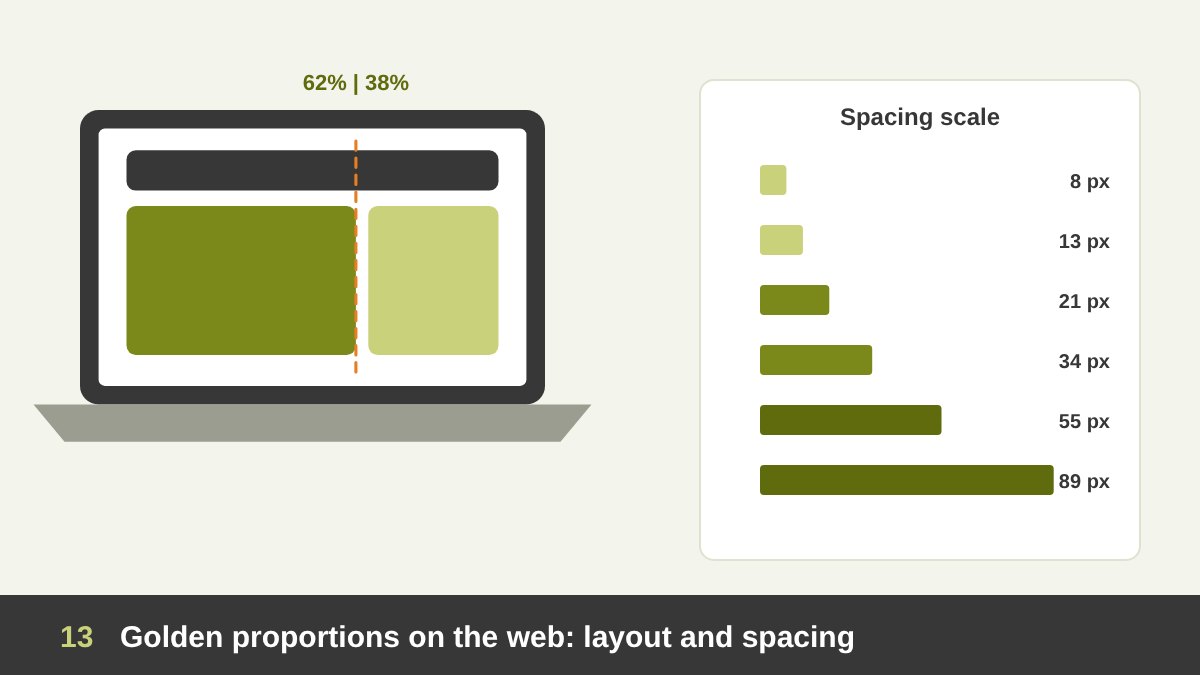
On websites, the classic use is the content and sidebar split. On a 1200 px container, a main column of about 740 px and a sidebar of about 460 px (including gutters) gives you a golden layout, which works well for blogs, articles and product pages. The same split works for hero sections (a large image beside a text block), for two-column feature sections and for the relationship between an image and its caption in a card.
The golden ratio is also useful for a spacing scale. Instead of choosing spacing values randomly, use a sequence like 8, 13, 21, 34, 55, 89 px (Fibonacci numbers) for padding, margins and gaps between sections. Small gaps inside a component, medium gaps between components and large gaps between sections then follow one rhythm, which is exactly what makes a design system feel calm. Many teams use a strict 4 or 8 px grid instead; you can combine both by rounding golden values to the nearest multiple of 4.
In UI and UX, remember three limits. First, responsive design changes everything: a 62/38 split on desktop usually becomes a single column on mobile, so the ratio guides proportions inside each block rather than the whole page. Second, usability comes first: button size, touch targets, readable line length and accessible contrast matter more than φ. Third, content changes: real text and images rarely fit perfect rectangles, so design flexible proportions. Used this way, the golden ratio gives your interface a consistent rhythm without fighting the user.
The Golden Ratio in Photography and Image Cropping
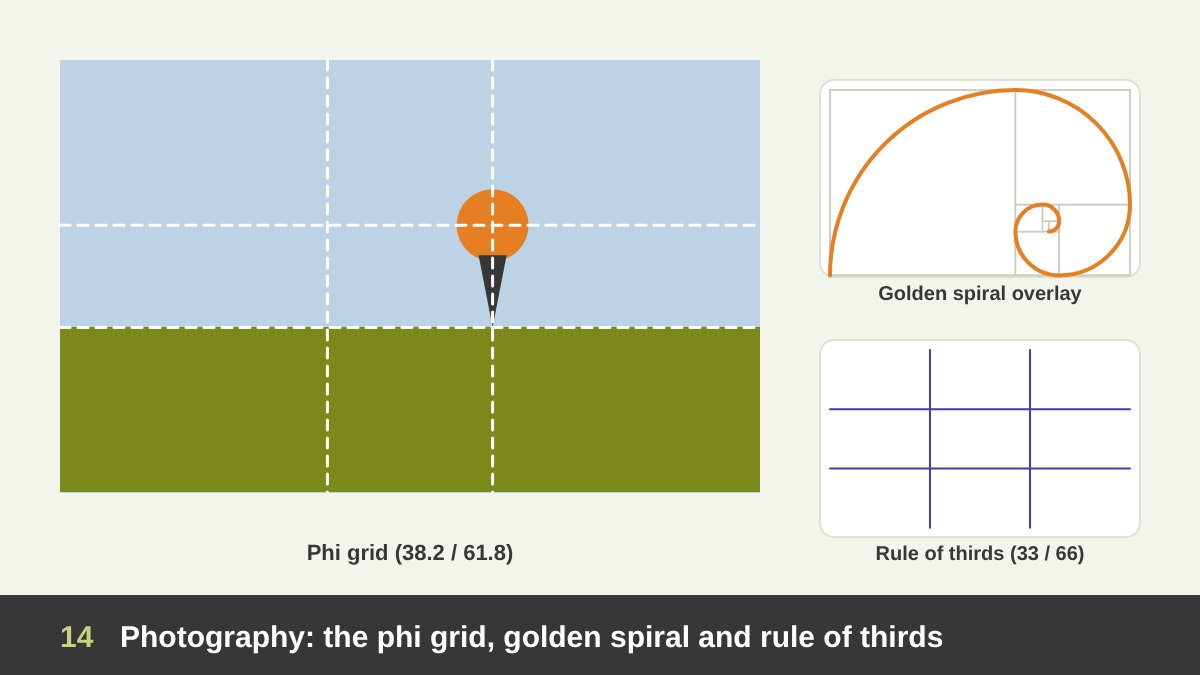
Photographers use the golden ratio mainly for composition. The phi grid divides the frame at 38.2% and 61.8%, so the lines sit a bit closer to the centre than the familiar rule of thirds. Placing your subject on one of the four intersections, or your horizon on one of the lines, gives a composition that feels balanced but not static. Many people actually learned the rule of thirds as a simpler version of the same idea.
The golden spiral overlay is another tool: place the tight end of the spiral on your subject (an eye, a face, a product, a door) and let the curve lead through the rest of the image. The crop tools in Adobe Lightroom and Photoshop include both the golden ratio grid and the golden spiral as overlays, and you can rotate the spiral in four directions.
For art directors this is useful when cropping photos for layouts: the same image often needs a wide banner crop, a square social crop and a vertical story crop, and checking each one against the phi grid helps keep the subject in a strong position. But a great photo with the subject in the centre is still a great photo; use the grid when it helps the story, not because you must.
The Golden Ratio in Painting, Drawing and Illustration
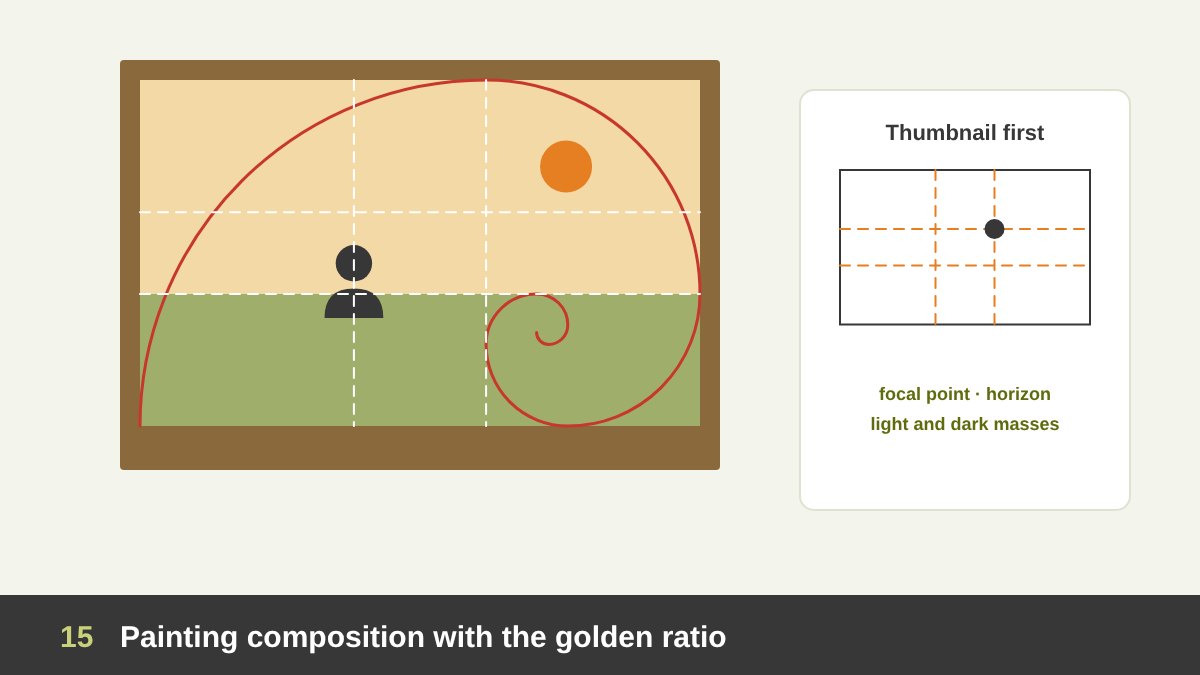
As a painter, I find the golden ratio most useful at the thumbnail stage, before any detail. When planning a painting or an illustration, divide the canvas with a phi grid and decide where the focal point goes, where the horizon sits and where the big masses of light and dark divide the surface. A golden spiral can also guide the movement of a composition: the eye enters on the wide curve and is led to the focal point at its centre.
It is also a good tool for canvas proportions. Many standard canvas sizes are close to golden or to 3:2 and 4:3, and choosing a format consciously changes the feeling of the work: a golden horizontal canvas suits landscapes and calm scenes, a golden vertical suits portraits and standing figures. Dalí’s Last Supper is a famous example of an artist choosing a golden format on purpose.
Still, painting is where the golden ratio should stay most flexible. Art is about expression, and many of the greatest paintings in history break every compositional rule. Use φ to train your eye, then let the painting tell you what it needs; I discuss that balance between rules and freedom in Art vs Design.
The Golden Ratio in Motion, Video and Presentations
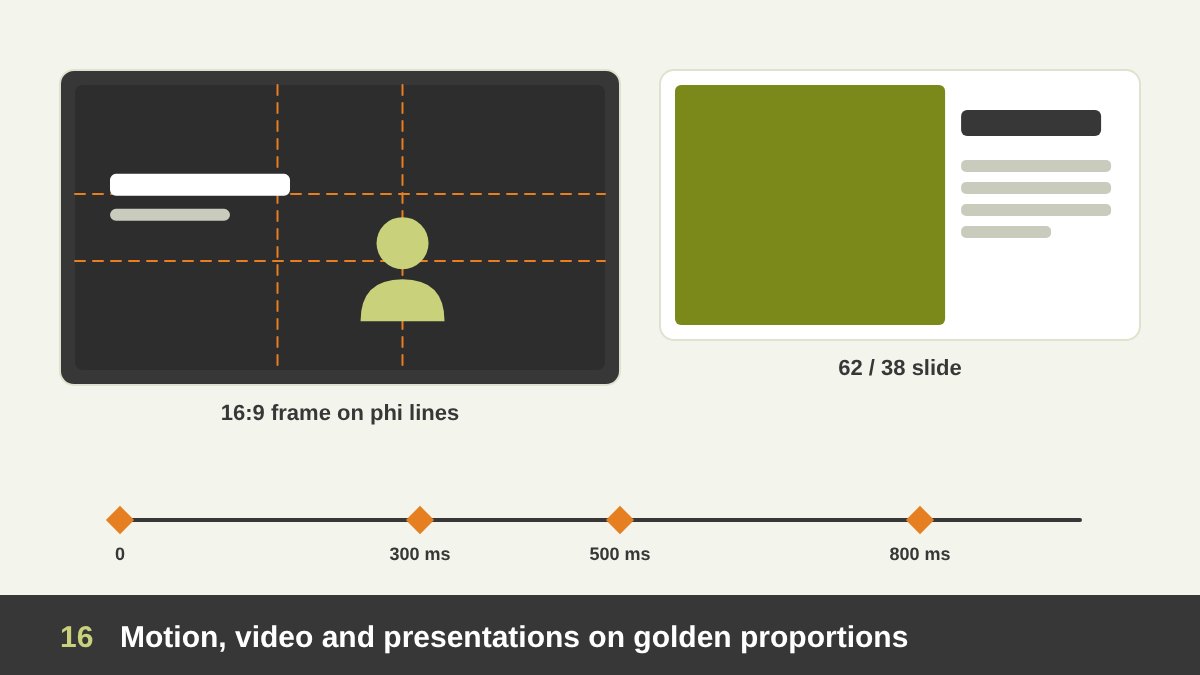
In video and motion design, the golden ratio works like it does in photography: use the phi grid to place the subject, the title and the brand mark inside the frame. The 16:9 widescreen format (1.78) is not golden, but the phi lines inside it still give strong positions. For interviews and talking heads, placing the eyes near the upper phi line and the face on a vertical phi line, looking towards the open space, is a reliable composition.
Some motion designers also use the ratio for timing and scale: an element that grows by 1.618 between keyframes, or animation durations that follow a golden sequence (for example 300, 500 and 800 ms) so fast, medium and slow movements feel related. It is not a rule of animation, but it is a neat way to keep a system consistent, especially in logo animations and UI motion.
In presentation design, a slide built on a 62/38 split (a big image on one side, the key message on the other) is one of the cleanest layouts you can use, and a golden type scale makes the hierarchy between the title, the main point and the notes very clear. If you present your own work to clients, the same structure helps; see How to Present Your Design Work.
The Golden Ratio in Print, Packaging, Stationery and Exhibition Design
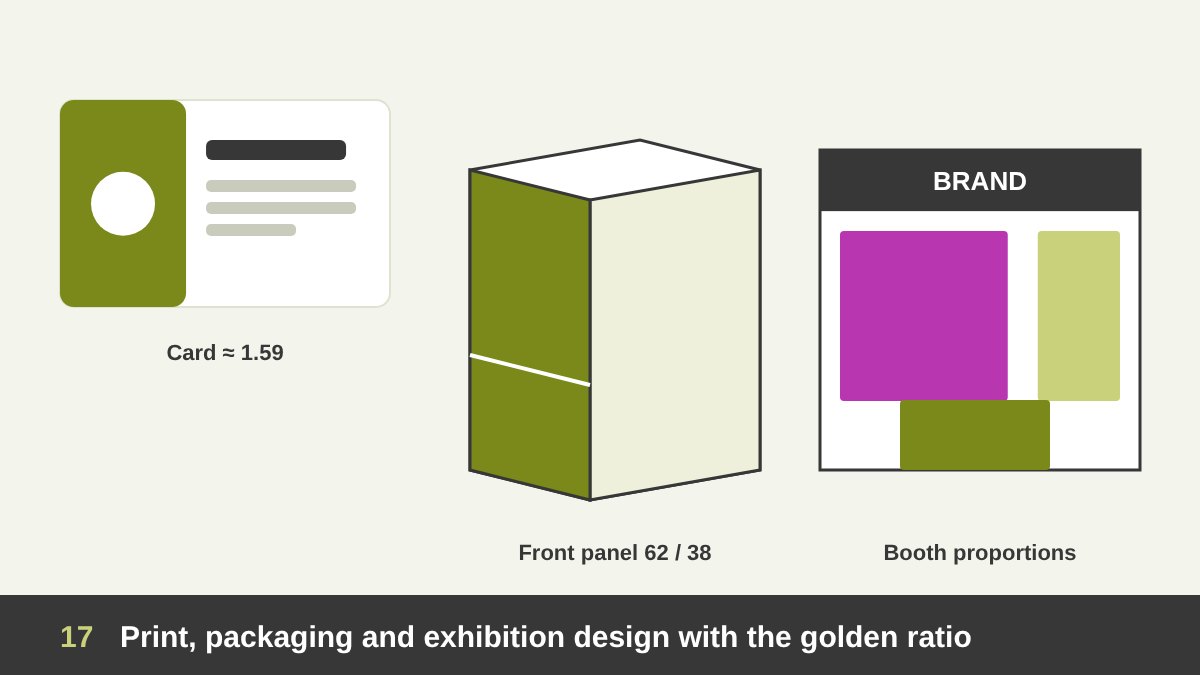
In stationery, you meet near-golden shapes every day. The standard bank card (85.6 × 54 mm) has a ratio of about 1.59, very close to φ, and a typical business card (85 × 55 mm) is about 1.55. Inside them, a 62/38 split between the logo area and the contact details, or a golden type scale between the name and the job title, gives an elegant, controlled result.
In packaging, the golden ratio helps divide the front panel: the brand zone, the product name, the image and the legal information can sit in golden bands so the hierarchy on the shelf is clear. It can also guide the proportions of the box or bottle itself, though structural limits, printing, shipping and shelf sizes always come first. Labels on bottles and jars are often designed with the main band at the golden height of the container.
In exhibition booth and spatial design, which I wrote about in Exhibition Booth Design, golden proportions help decide the height of the header compared to the walls, the width of graphic panels, the position of the counter and the eye-level band for the main message. Here the human body is the real measure, which is exactly what Le Corbusier’s Modulor tried to combine with φ. Always check proportions in a 3D view at human eye height, because what looks golden in a flat drawing can feel very different when you stand in front of it.
How to Use the Golden Ratio Without Becoming a Slave to It
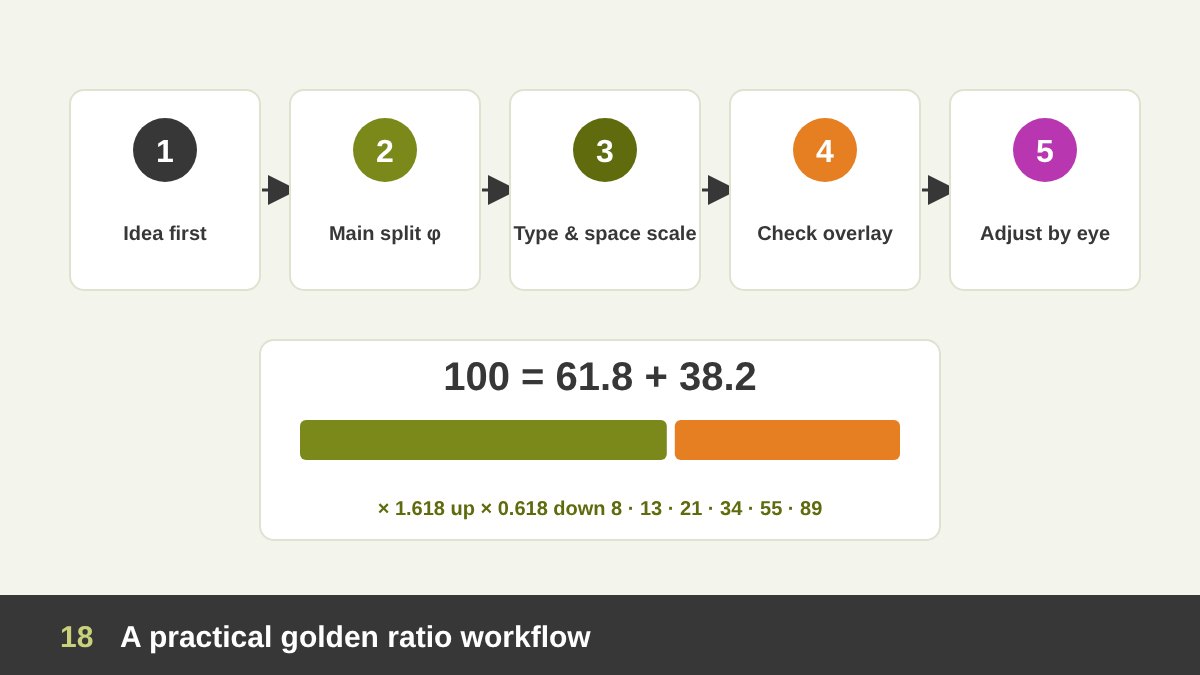
After everything above, here is the practical workflow I recommend. 1. Start with the idea and the content. What must the design say, and what is most important? 2. Apply φ to the one or two biggest decisions: the main split of the space, the format, or the size of the hero element. 3. Build your scales: a type scale and a spacing scale based on 1.618 or on Fibonacci numbers. 4. Check with an overlay (a phi grid or spiral in Photoshop, Illustrator, Figma or a golden ratio app). 5. Adjust by eye: if something looks wrong, it is wrong, even if the maths is perfect.
The quick numbers to remember: multiply by 1.618 to go up a level, multiply by 0.618 to go down, and split anything into 61.8% and 38.2%. For 1000 px that is 618 and 382; for an A4 width of 210 mm it is about 130 and 80 mm. Fibonacci numbers (8, 13, 21, 34, 55, 89, 144) give you the same proportions in whole numbers.
Finally, know when not to use it. When a client has strict brand guidelines, when a platform has fixed formats, when accessibility needs larger sizes, or when the content simply does not fit, other proportions are better. The golden ratio is one tool in a big toolbox, alongside grids, the rule of thirds, simple ratios and, above all, your trained eye. You can see how I apply proportion across branding, web, painting and print in my portfolio, and if you need a designer for your project, get in touch. Here is a summary of how to use it in every field:
| Field | Where the golden ratio helps | Quick numbers |
|---|---|---|
| Graphic design and layout | Splitting image and text, placing headlines and visuals | 62% / 38%, phi grid lines at 38.2% and 61.8% |
| Logo design | Construction grids, curves, symbol vs wordmark size | Circles of 13, 21, 34, 55, 89 or 1 : 1.618 : 2.618 |
| Typography | Type scale between body, subheads and headings | 16 → 26 → 42 → 68 px |
| Websites and UI/UX | Content vs sidebar, hero sections, cards, spacing scale | 740 / 460 px on 1200 px; spacing 8, 13, 21, 34, 55 |
| Photography | Subject and horizon placement, cropping | Phi grid and golden spiral overlay in Lightroom and Photoshop |
| Painting and illustration | Focal point, horizon, movement, canvas format | Phi grid on thumbnails, golden or 3:2 canvas |
| Motion and video | Framing in 16:9, scale steps, timing | Phi lines in the frame; durations like 300, 500, 800 ms |
| Presentations | Slide layouts and text hierarchy | 62/38 image and message; ×1.618 title scale |
| Print, stationery and packaging | Card layout, label bands, front-panel hierarchy | Cards close to 1.59; main band at 61.8% height |
| Exhibition and spatial design | Header vs wall height, panel widths, counter position | Check proportions at human eye height, Modulor-style |
The Golden Ratio in Design: Frequently Asked Questions
What is the golden ratio in simple words?
The golden ratio is a proportion of about 1 to 1.618. When you divide something into two parts so that the whole compared to the bigger part is the same as the bigger part compared to the smaller part, the parts are in the golden ratio. Designers use it as a split of roughly 62% and 38%.
Who discovered the golden ratio?
No single person discovered it. Ancient Greek mathematicians studied it through the pentagon and pentagram, and Euclid gave the first written definition, the “extreme and mean ratio”, in his Elements around 300 BC. Fibonacci published the related number sequence in 1202, Luca Pacioli called it the divine proportion in 1509, and Martin Ohm first called it the golden section in 1835.
What is the difference between the golden ratio and the Fibonacci sequence?
The golden ratio is a single irrational number, about 1.618. The Fibonacci sequence is a list of whole numbers (1, 1, 2, 3, 5, 8, 13, 21…) where each is the sum of the two before it. The ratio between neighbouring Fibonacci numbers gets closer and closer to the golden ratio, so designers often use Fibonacci numbers as practical golden sizes.
Was the Apple logo designed with the golden ratio?
There is no evidence that it was. The Apple logo was designed by Rob Janoff in 1977, who based it on sketches of real apples, and there is no record of a golden ratio grid from that time. The famous image with golden circles over the apple was made by someone else decades later. The same applies to many other “golden ratio logos” shared online.
Is the golden ratio the same as the rule of thirds?
No, but they are close relatives. The rule of thirds divides the frame at 33.3% and 66.7%, while the golden ratio (phi grid) divides it at 38.2% and 61.8%, so its lines are a little closer to the centre. Both help you place the subject away from the centre for a more dynamic composition.
Do I have to use the golden ratio to be a good designer?
No. Many excellent designs use other proportions, simple ratios or none at all. The golden ratio is a useful tool for making consistent decisions about size and space, but strong ideas, clear hierarchy, good typography and a trained eye matter far more.
Leave a Reply